What does the above graph ( insert Fig. 4.1 ) represent?
A) Choice is a function of incentives to participant
B) Incentives are a function of choice to engage in attitude change
C) Higher freedom to choose means you need more money to change your attitudes
D) Mean attitude change as a function of choice and incentive conditions
Question 2
Thelma is conducting a study on the political attitudes of college students. In an attempt to form equivalent experimental groups, Thelma randomly assigns the students to one of three different conditions, based on the students' grade point averages.
In this example, GPA represents the
a. independent variable.
b. dependent variable.
c. matching variable.
d. confounding variable.

 A sidewheeler on the Mississippi. In 1856 Samuel Clemens became an apprentice to a steamboat pilot a
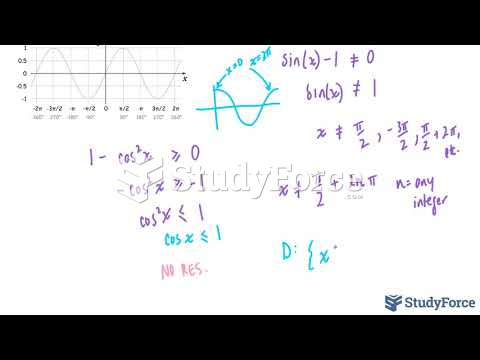 How to find the domain when sine and cosine are in the same function
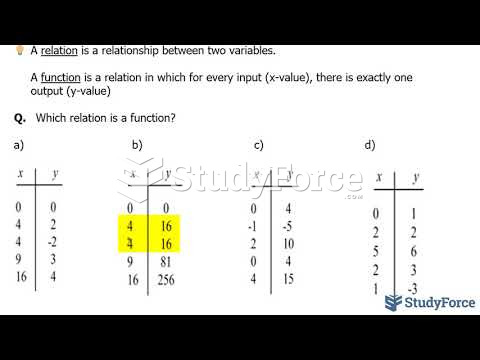 How to determine if a table of values represents a function
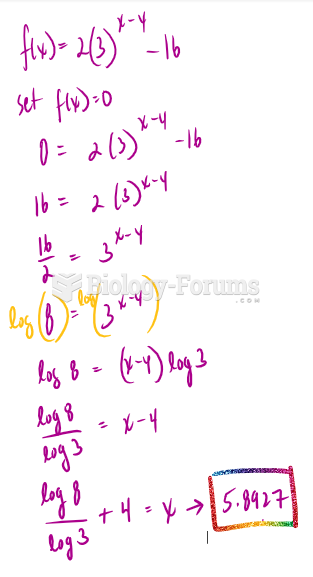 Algebraically determine the x intercept of the exponential function
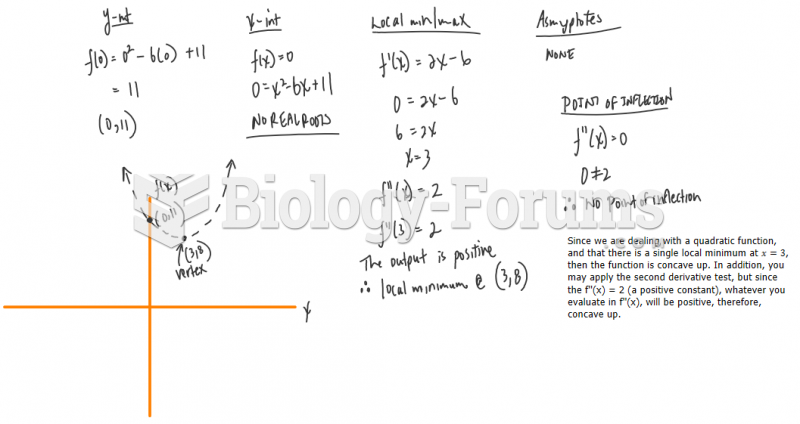 Sketch the graph of the following functions using local maximum/minimums, interc
 Effects of disrupted growth hormone function