What does the above graph ( insert Fig. 4.1 ) represent?
A) Choice is a function of incentives to participant
B) Incentives are a function of choice to engage in attitude change
C) Higher freedom to choose means you need more money to change your attitudes
D) Mean attitude change as a function of choice and incentive conditions
Question 2
Thelma is conducting a study on the political attitudes of college students. In an attempt to form equivalent experimental groups, Thelma randomly assigns the students to one of three different conditions, based on the students' grade point averages.
In this example, GPA represents the
a. independent variable.
b. dependent variable.
c. matching variable.
d. confounding variable.

 Pituitary gland function
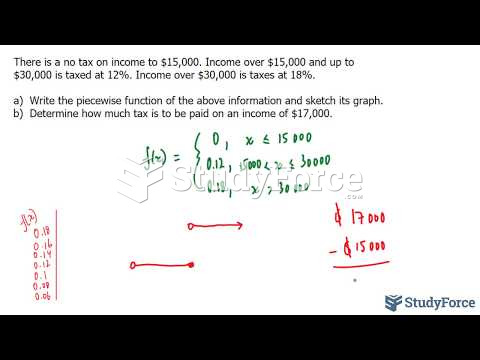 How to evaluate and sketch a piecewise function pertaining to tax (Part 3)
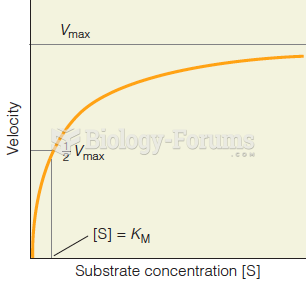 Reaction velocity as a function of substrate concentration
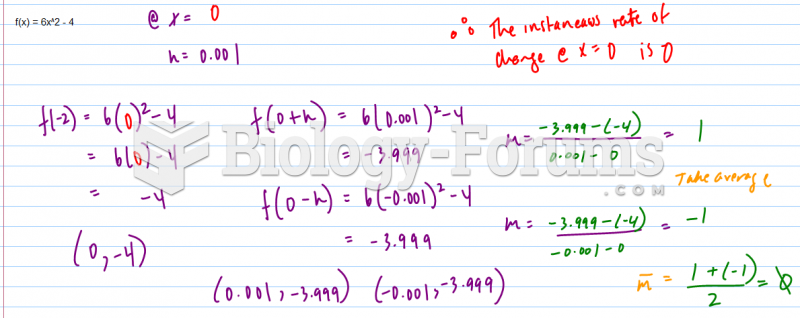 For each function f(x) = 6x^2 - 4, estimate the instantaneous rate of change for the given ...
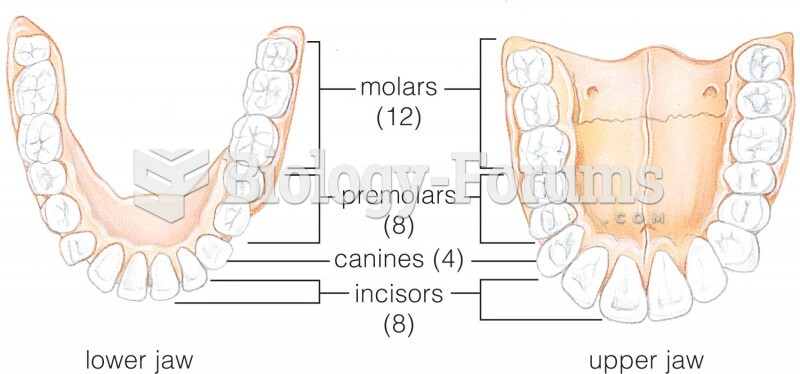 Structure and function of human teeth.
 Effects of disrupted growth hormone function