This topic contains a solution. Click here to go to the answer
|
|
|

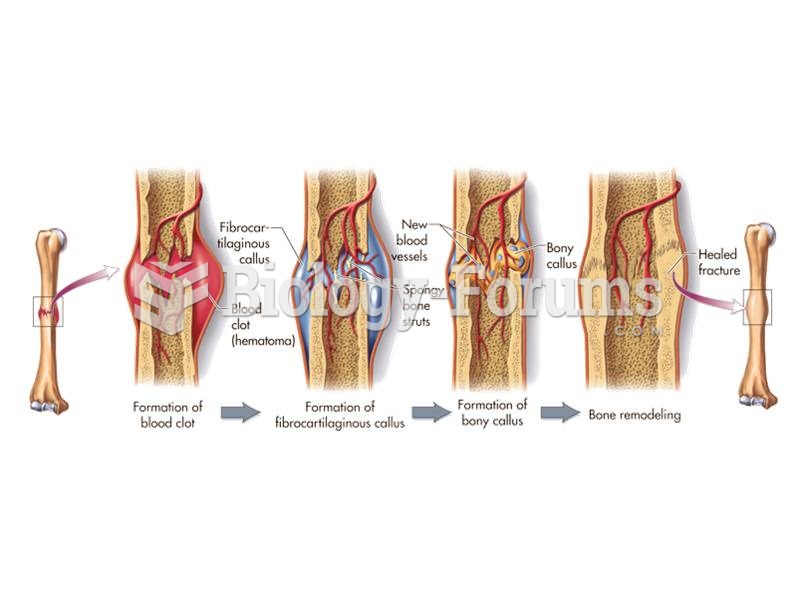 Bone fractures that occur before death show signs of healing. The process of fracture healing starts
 Lilly Martin Spencer’s Young Husband: First Marketing (1854). Note that passers-by are amused at thi
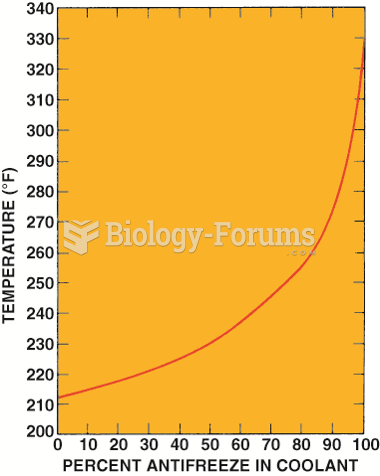 Graph showing how the boiling point of the coolant increases as the percentage of antifreeze in ...
 Typical Work Settings for Massage Therapists
 Turning Play into Work
 I'm Gonna Show You (Original Mix)