This topic contains a solution. Click here to go to the answer
|
|
|

 A fixed action pattern as an example of innate behaviour.
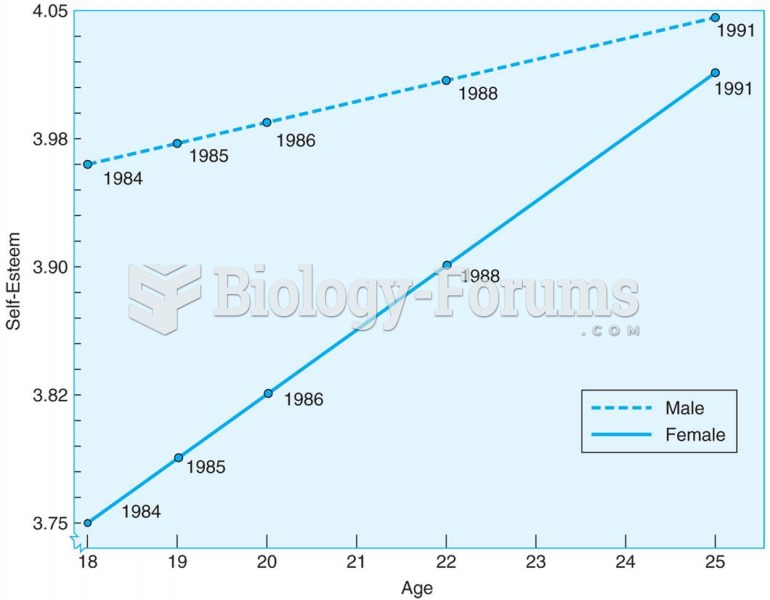 Young adults increase in self-esteem between the ages of 18 and 25, according to this longitudinal s
 Air-Temperature Data
 What is the frequency of 20-mm microwaves? (c = 3.0 × 10⁸ m/s) A) 100 MHzB) 400 MHzC) 15 GHzD) ...
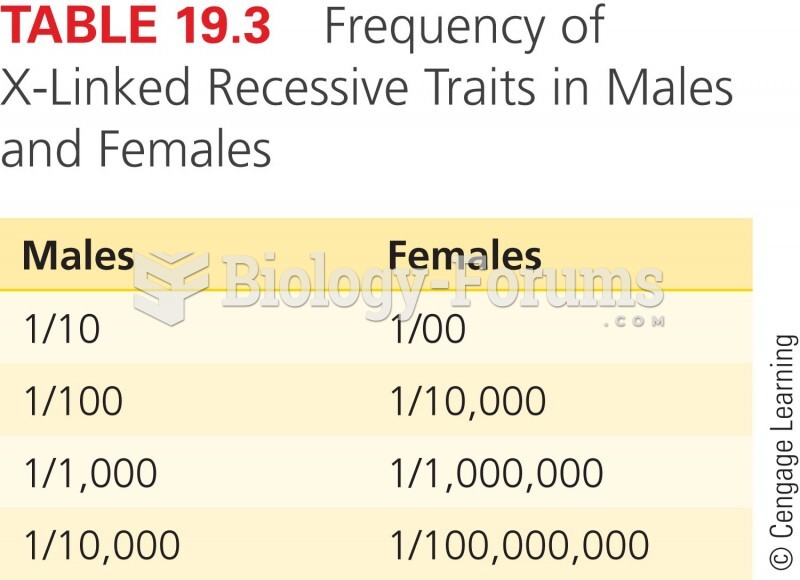 Frequency of X-Linked Recessive Traits in Males and Females
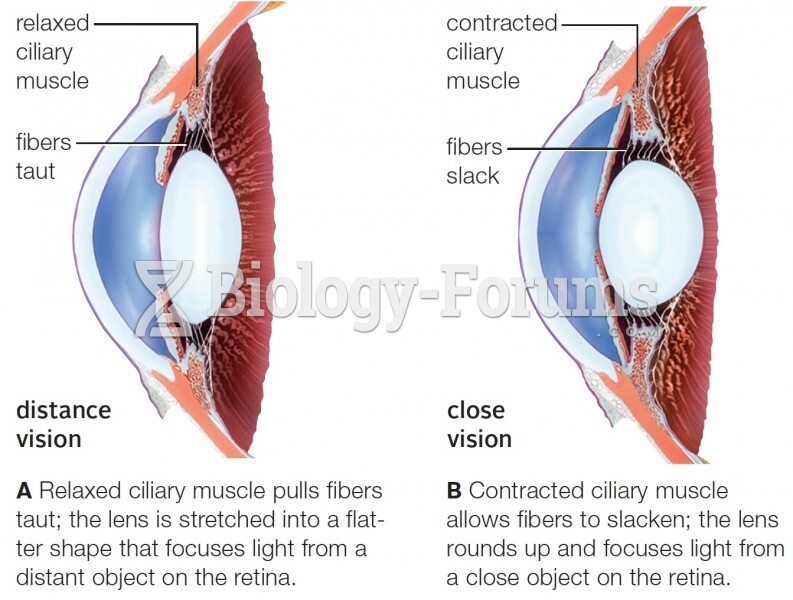 Pattern of retinal stimulation in the human eye