This topic contains a solution. Click here to go to the answer
|
|
|

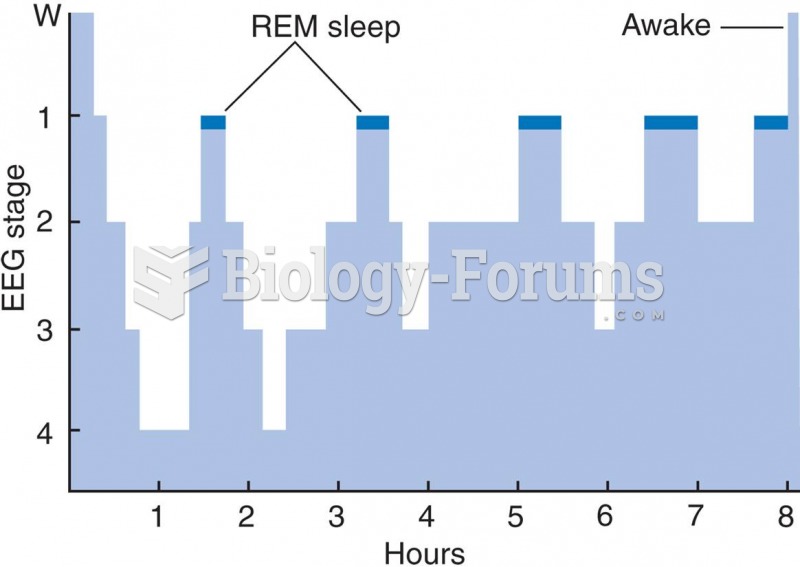 A Typical Pattern of Sleep Stages During a Single Night
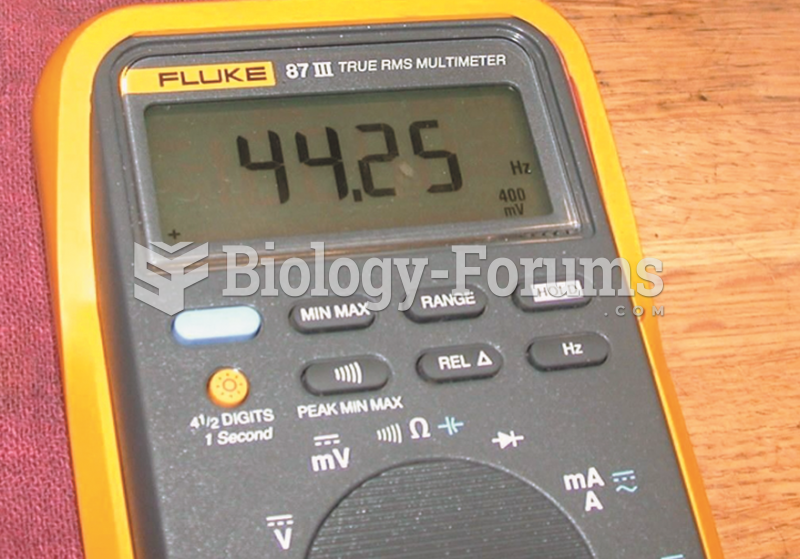 The first step is to verify the proper operation of the tester by measuring the air frequency by ...
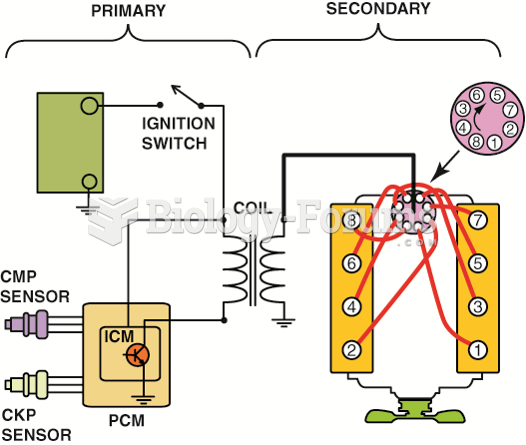 The primary ignition system is used to trigger and therefore create the secondary (high-voltage) ...
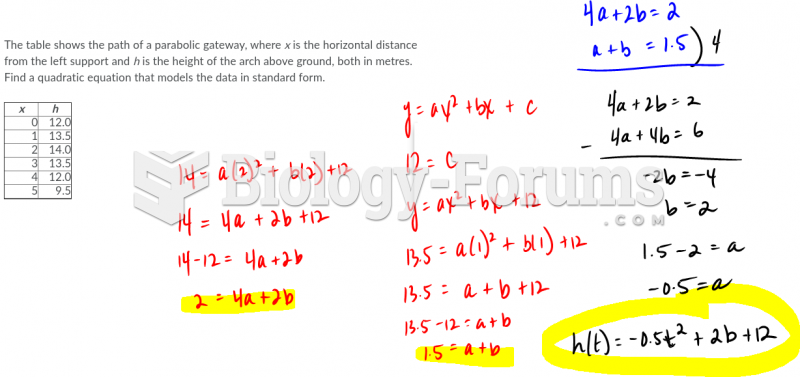 Find a quadractic equation that models the data in standard form
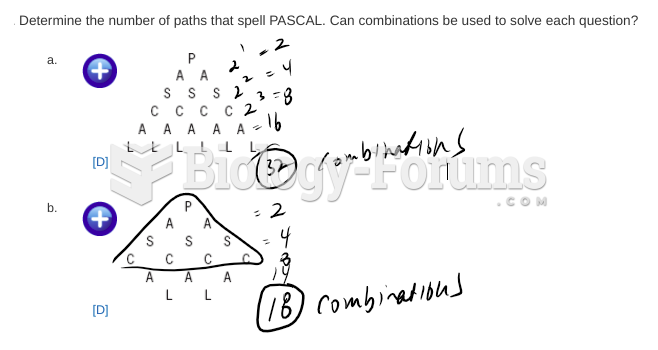 Data management questions
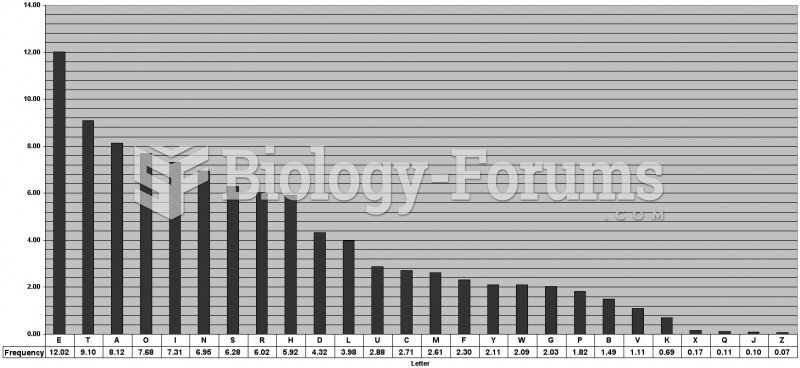 Letter Frequency Table