|
|
|

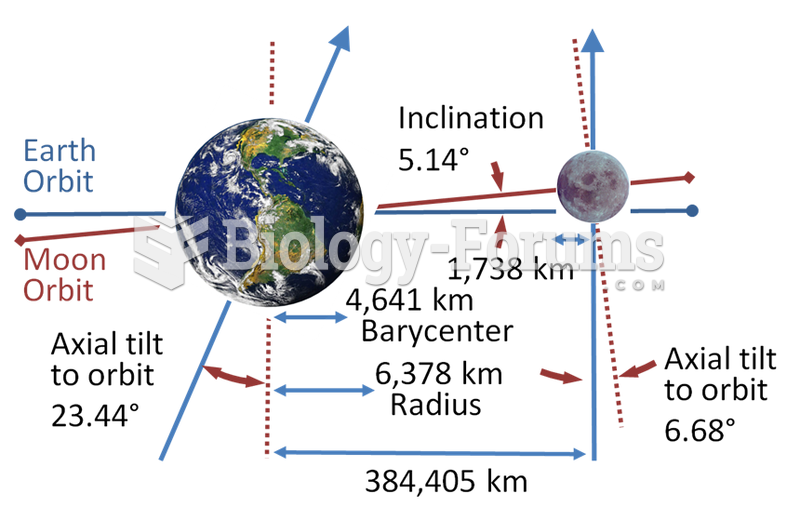 Schematic of the Earth–Moon system (without a consistent scale)
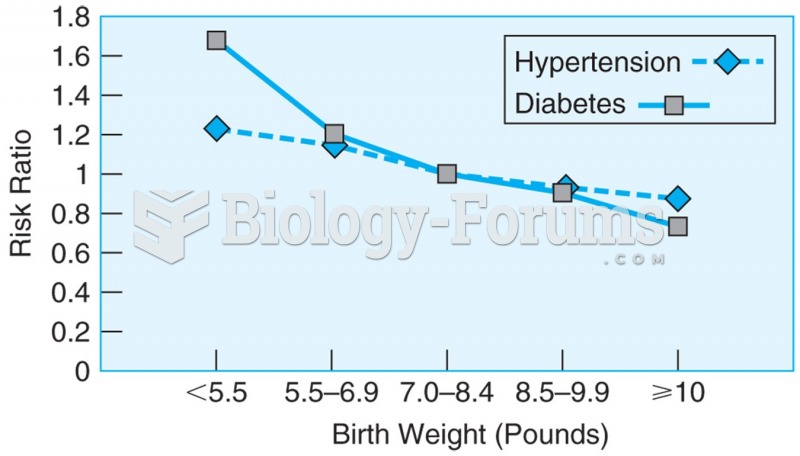 Data from more than 22,000 men over the age of 40, showing the relationship between birth weight and ...
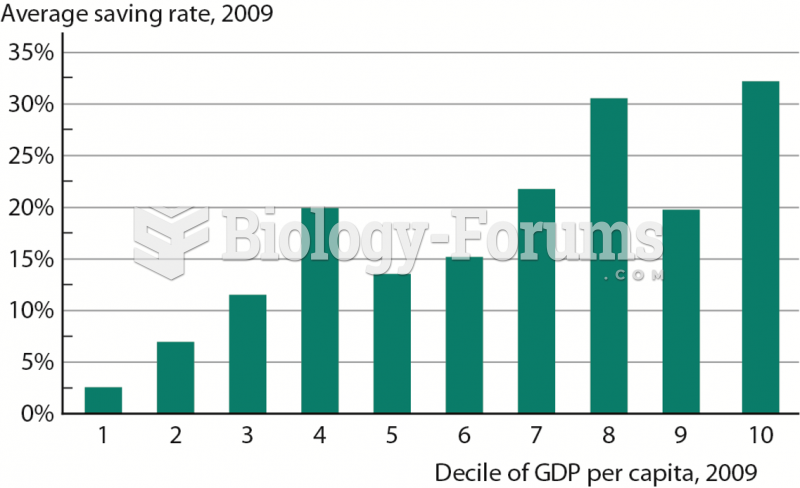 Saving Rate by Decile of Income per Capita
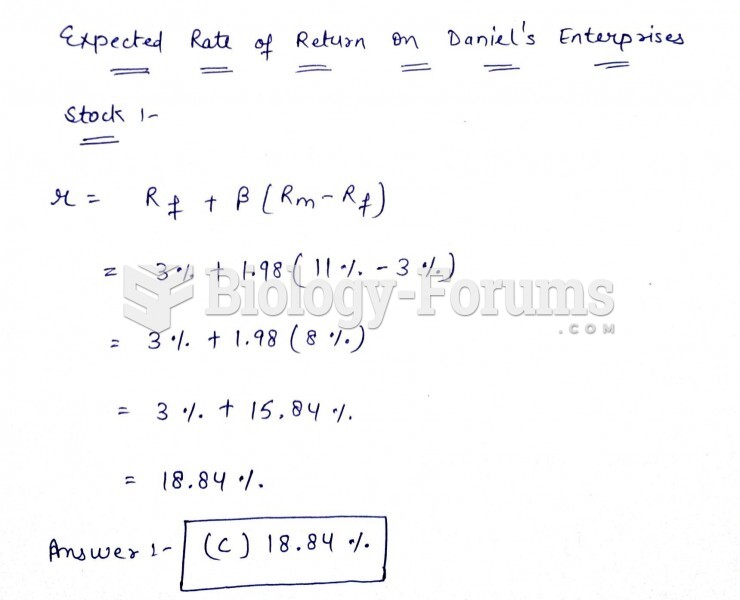 Daniel's Enterprises has a beta of 1.98 and a growth rate of 12 percent. The stock is ...
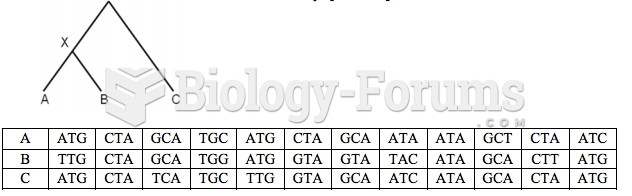 Outgroup role in relative rate test
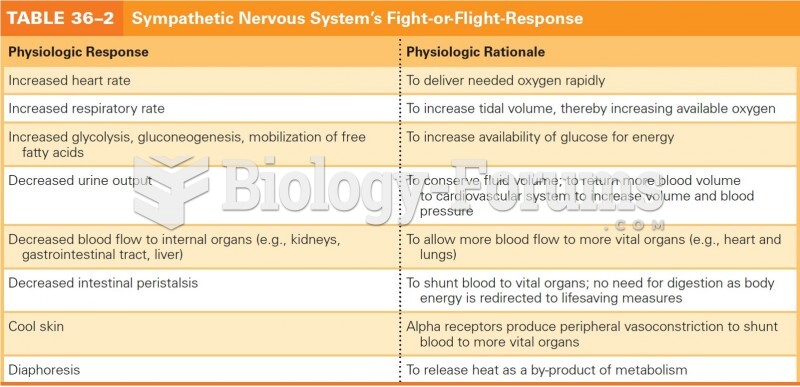 Sympathetic Nervous System's Flight or Fight Response