This topic contains a solution. Click here to go to the answer
|
|
|

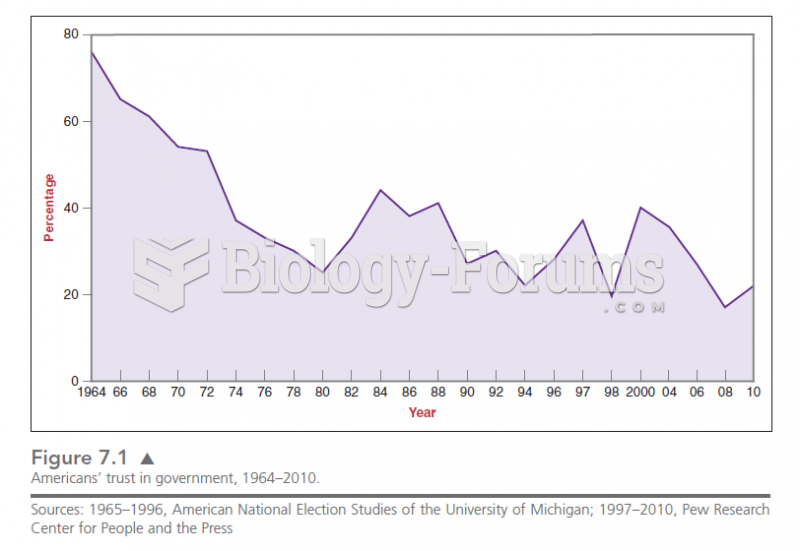 Figure 7.1 shows the rapid decline in the trust of Americans in government since the 1960s. This de
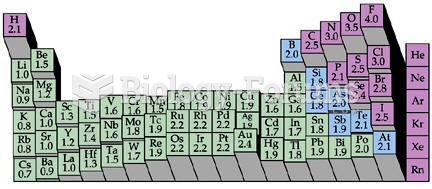 Electronegativity Chart (Periodic Table)
 Who's line is it anyway
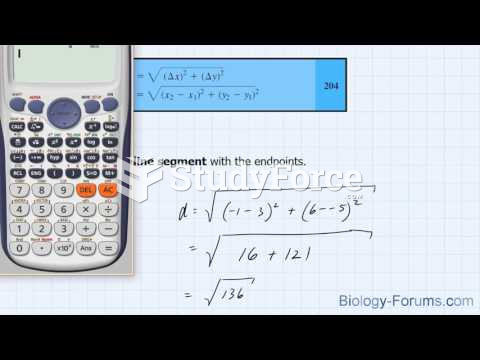 How to find the distance of any line segment
 Tai chi stance with front foot pointing straight ahead and back foot at 45° angle, heels in line, ...
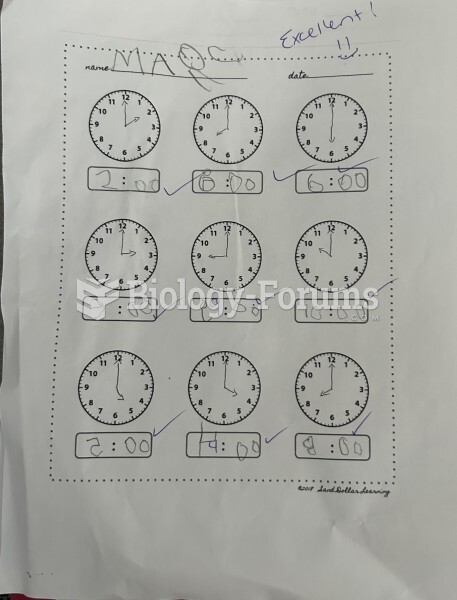 Time homework