This topic contains a solution. Click here to go to the answer
|
|
|

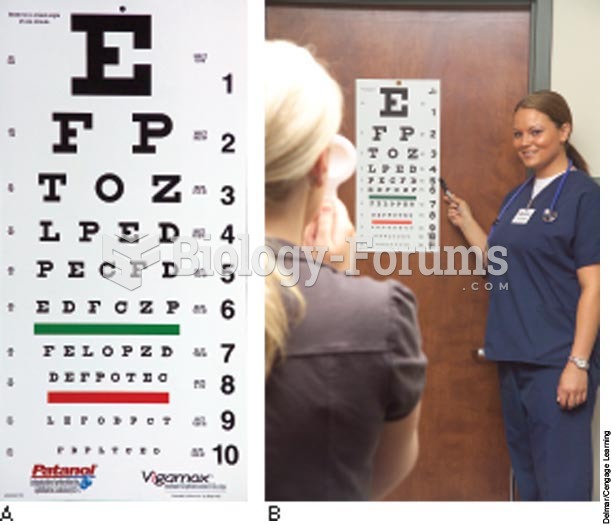 Snellen chart
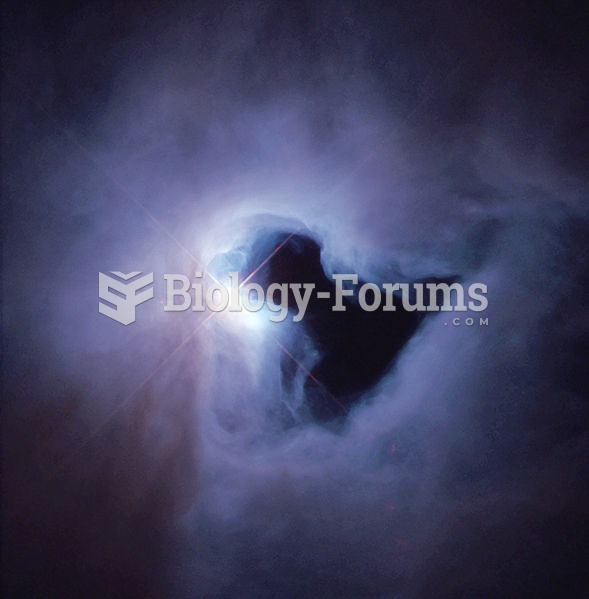 The reflection nebula NGC 1999 is brilliantly illuminated by V380 Orionis (center), a variable star
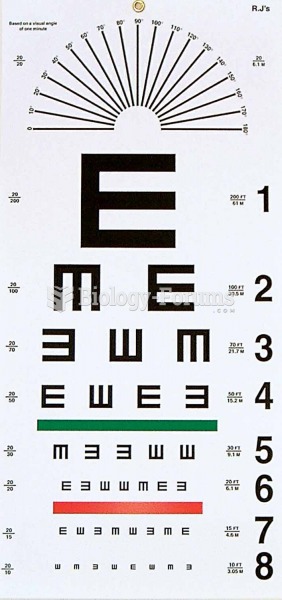 Snellen chart.
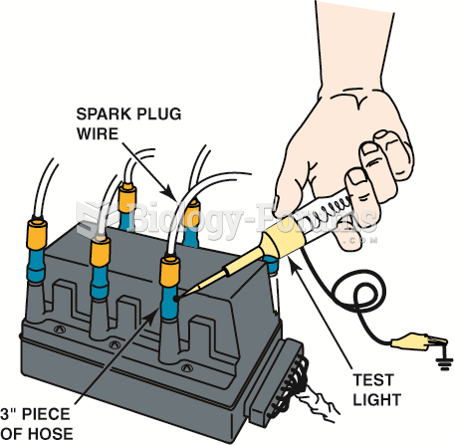 Using a vacuum hose and a grounded test light to ground one cylinder at a time on a DIS. This works ...
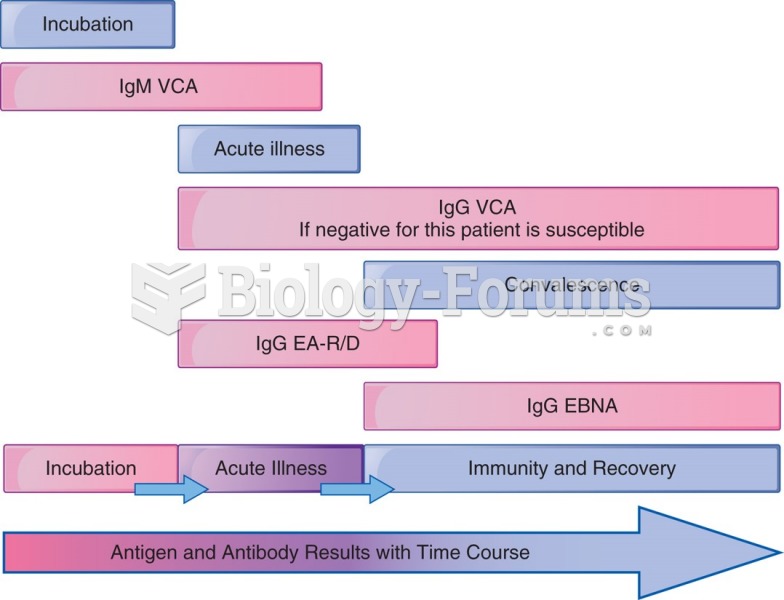 Time course for antibodies to the EBV viral–specific antigens.
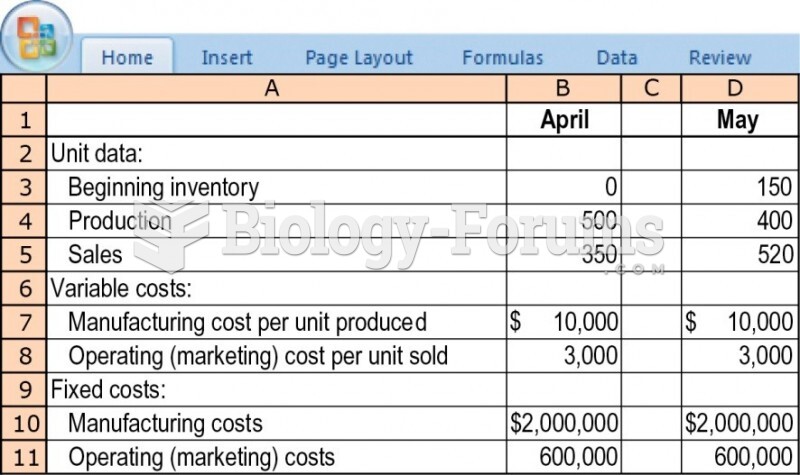 Variable and absorption costing, explaining operating-income differences.