This topic contains a solution. Click here to go to the answer
|
|
|

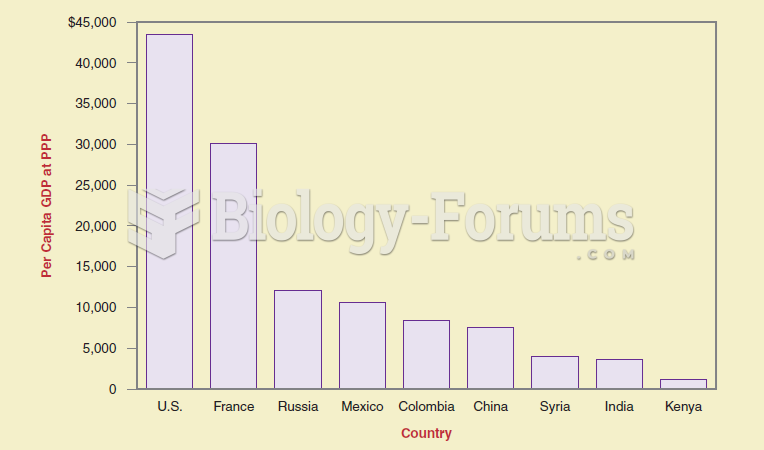 If you want to show differences between items at the same time, a bar graph is more effective than a
 Barenaked Ladies - Lovers in a Dangerous Time
 In middle childhood, children spend increasing amounts of time with peers and friends.
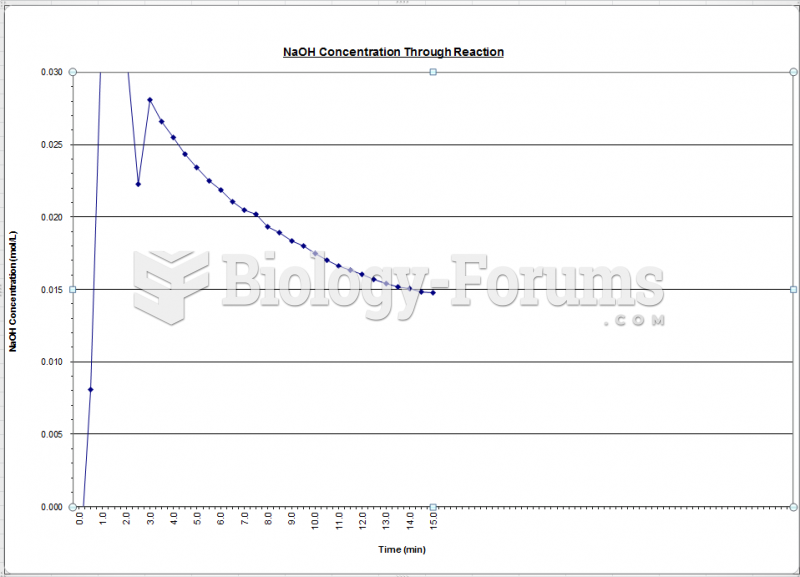 Fluidization - Concentration NaOH Chart
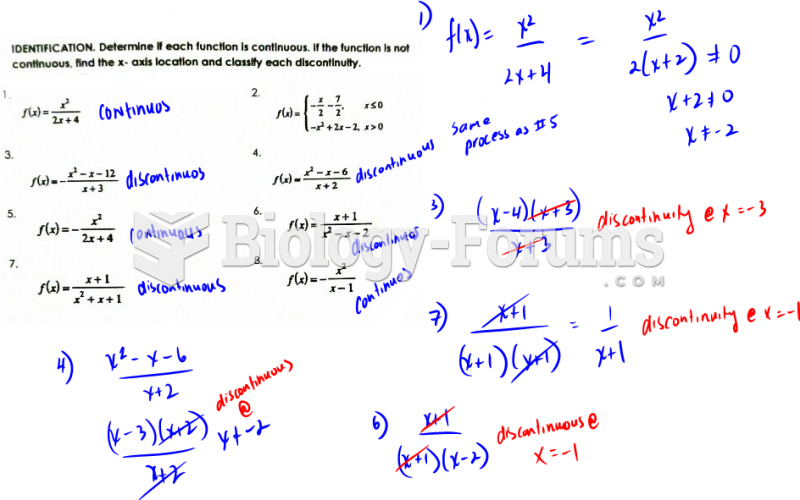 Determine if each function is continuous, If the function is not continuous, find the x-axis
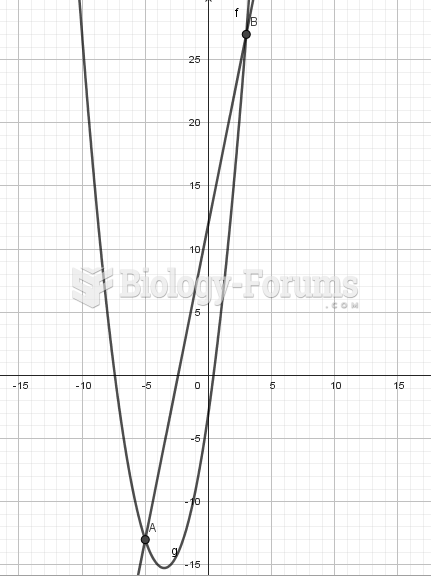 The line with the equation y=5x+12 intersects the parabola with equation y=xsqared+7x-3 at the ...