|
|
|

 Two women having a conversation using American Sign Language.
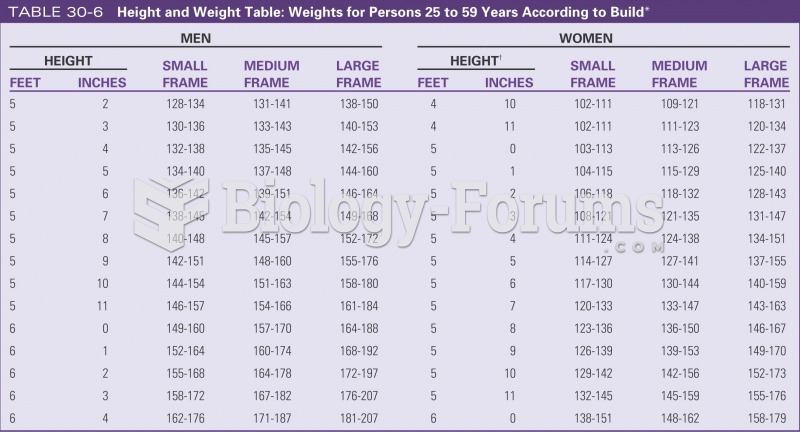 Height and weight table
 Women have the role of kinkeeper in almost all cultures. This may cause them to react to stress by ...
 A Pokot married woman, Kenya.
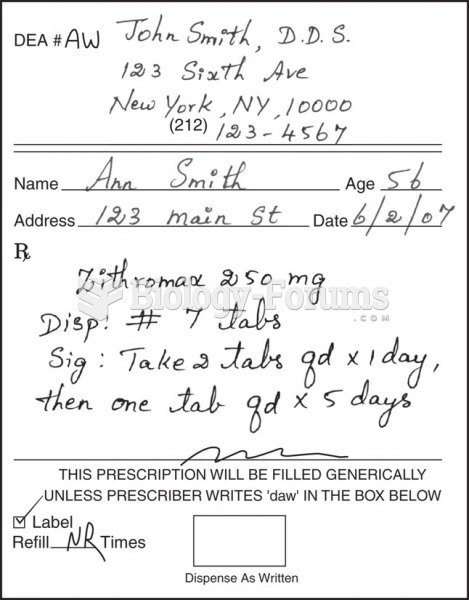 Sample prescriptions of antibiotics for dental infections.
 Maintaining Weight Loss