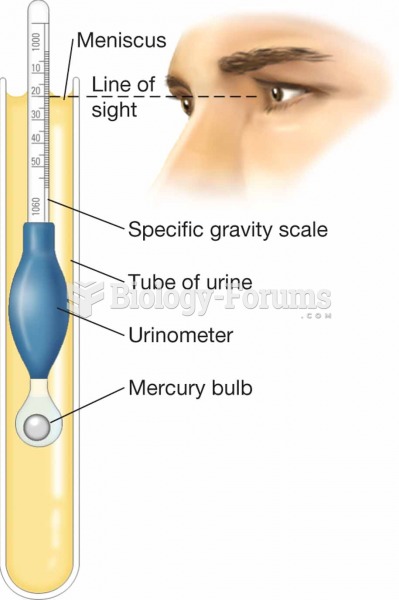
Author Question: A researcher obtains a random sample of 100 women and records the weight of each woman. She ... (Read 38 times)

future617RT

  • Hero Member
  • *****
  • Posts: 543
A researcher obtains a random sample of 100 women and records the weight of each woman. She constructs a histogram showing the distribution of weights in the sample.
 
  Does this histogram show the shape of the sampling distribution of sample means? Explain.

Question 2

The area under the normal distribution is equal to .
 
  a. 1.0
  b. 10
  c. 100
  d. various values, depending on the shape of the distribution


babybsemail

  • Sr. Member
  • ****
  • Posts: 304
Answer to Question 1

No. The histogram shows the distribution of weights in one sample. The sampling distribution would show the distribution of the sample means for all possible samples of size 100.

Answer to Question 2

A


Related Topics

Need homework help now?

Ask unlimited questions for free

Ask a Question
 

Did you know?

Walt Disney helped combat malaria by making an animated film in 1943 called The Winged Scourge. This short film starred the seven dwarfs and taught children that mosquitos transmit malaria, which is a very bad disease. It advocated the killing of mosquitos to stop the disease.

Did you know?

Most women experience menopause in their 50s. However, in 1994, an Italian woman gave birth to a baby boy when she was 61 years old.

Did you know?

Lower drug doses for elderly patients should be used first, with titrations of the dose as tolerated to prevent unwanted drug-related pharmacodynamic effects.

Did you know?

The lipid bilayer is made of phospholipids. They are arranged in a double layer because one of their ends is attracted to water while the other is repelled by water.

Did you know?

You should not take more than 1,000 mg of vitamin E per day. Doses above this amount increase the risk of bleeding problems that can lead to a stroke.

For a complete list of videos, visit our video library