|
|
|

 Nurse examining and measuring hematuria sample from client with a UTI
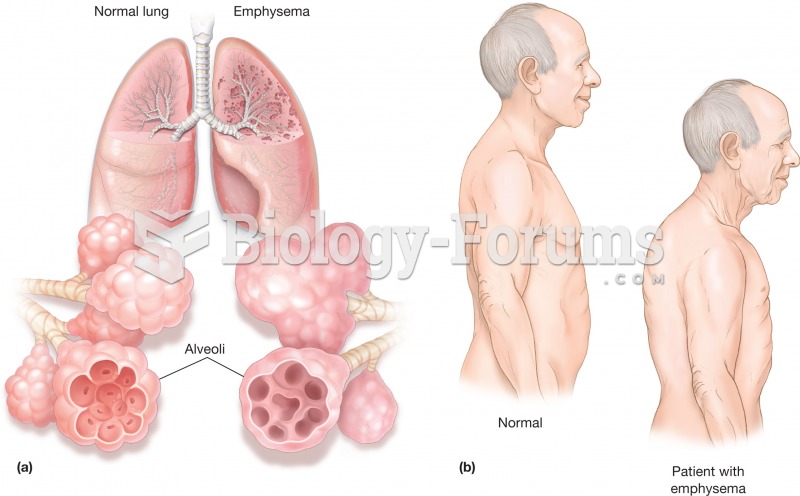 Emphysema. (a) Illustration comparing normal lungs and emphysemic lungs. The inserts illustrate how
 Some scholars regard Walt Whitman as a poet of nature, and others, a poet of the body—a reference to
 A greater number of men than women hold full-time jobs, but the gap is closing because of an ...
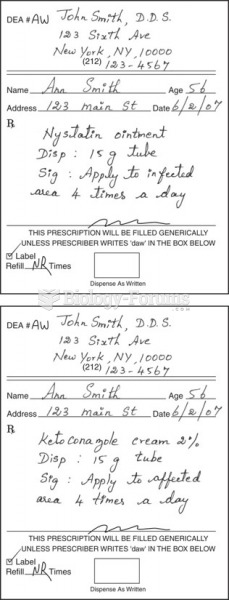 Sample prescriptions of drugs for oral fungal infections.
 Assist recipient into side-lying position. Woman sits on edge of table holding drape to cover her ...