This topic contains a solution. Click here to go to the answer
|
|
|

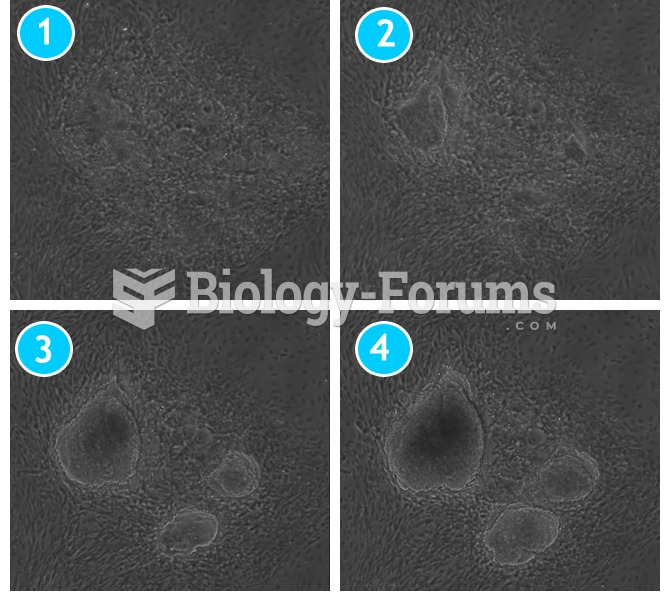 Time-course of reprogramming mouse fibroblasts into induced pluripotent stem cells
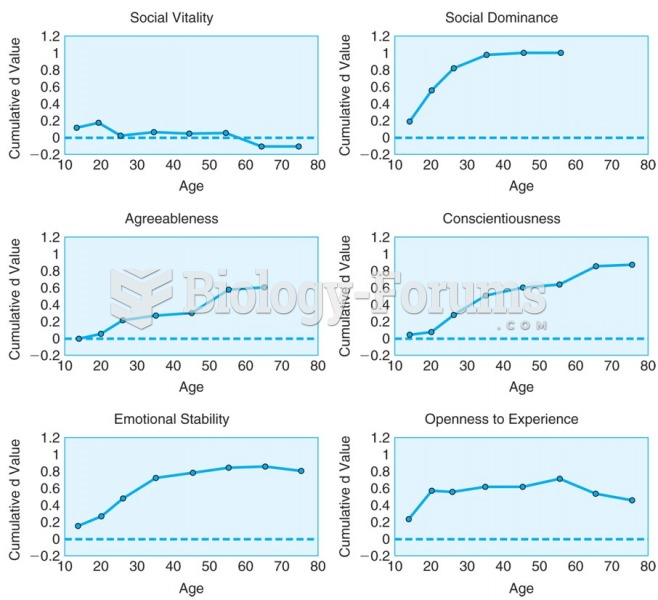 Cumulative change for six personality-trait domains across the life course show distinct patterns.
 Greet a First-Time Client With a Firm Handshake.
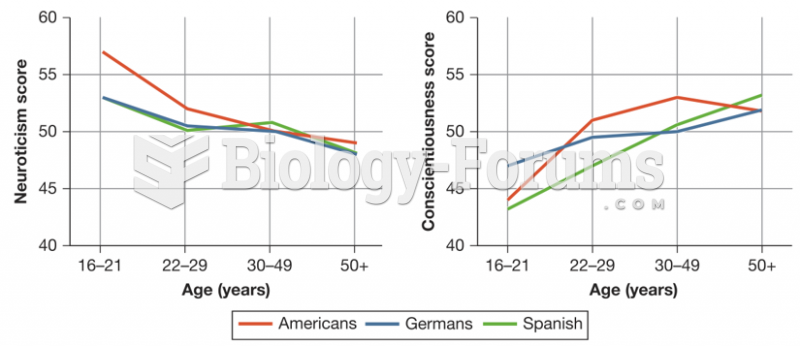 Consistency and Change in Personality Over the Lifespan
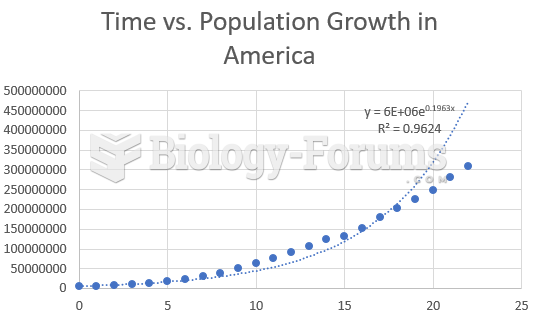 Time vs. USA Population Exponential
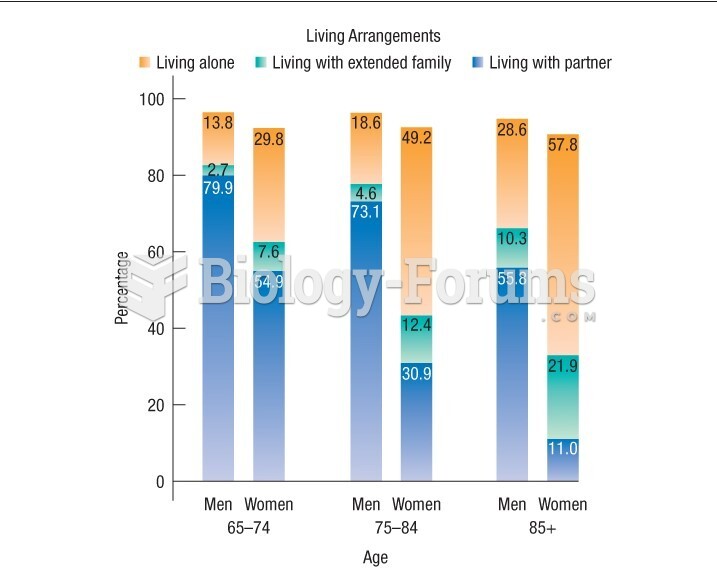 Graph shows the living arrangements of Canadian seniors