|
|
|

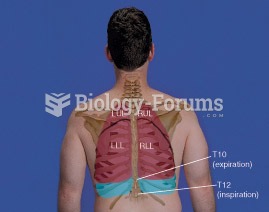 Lungs: RUL = Right Upper Lobe, RML = Right Middle Lobe, RLL = Right Lower Lobe, LUL = Left Upper Lob
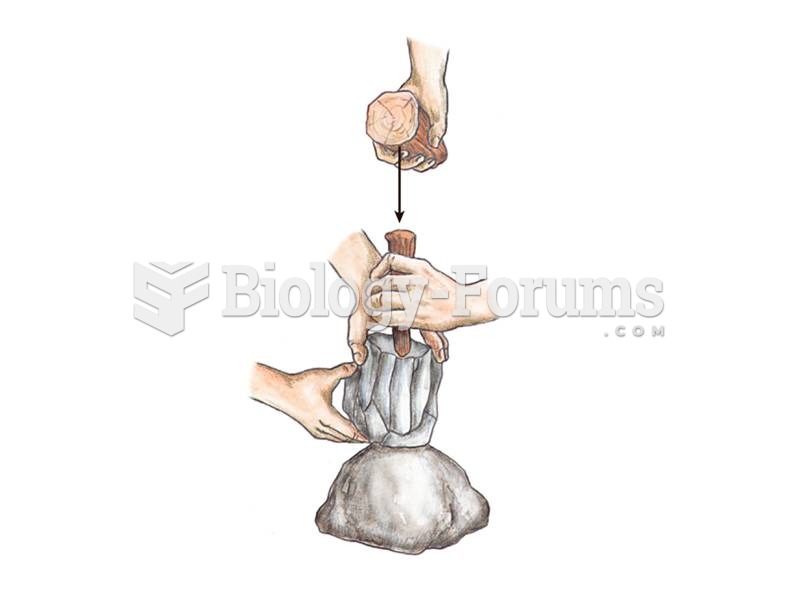 Upper Paleolithic stone tools include blade-based tools as seen here being produced from a blade cor
 Standing at the head of the table, apply effleurage to upper trapezius from neck to shoulder using a ...
 Apply direct thumb pressure into points along the upper trapezius from base of neck to shoulder. ...
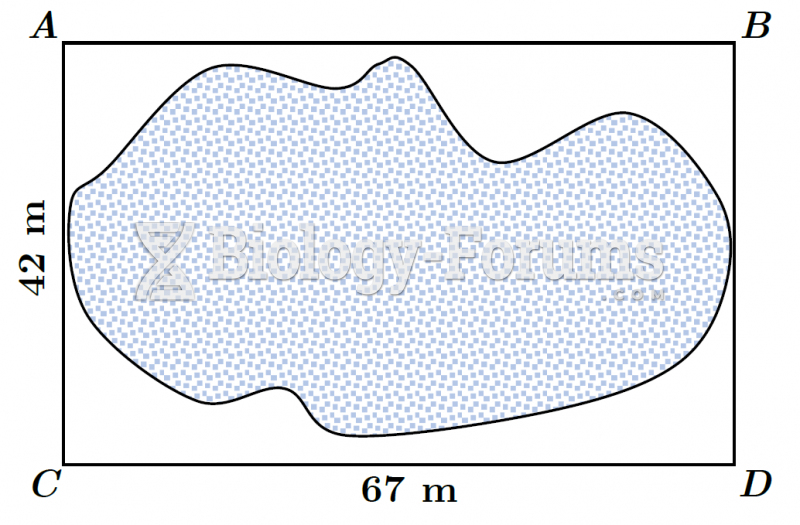 Plot of Land (Modified Offset Method) - Boxed
 Relationship of a DNA base sequence to peptide structure