|
|
|

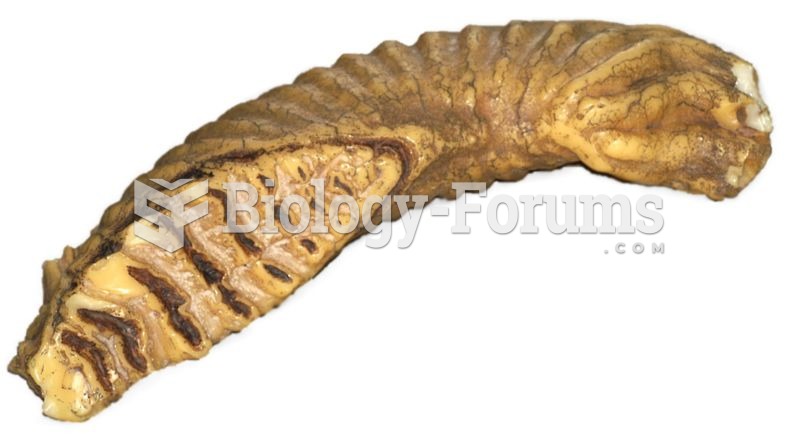 Replica of an Asian elephant's molar, showing upper side.
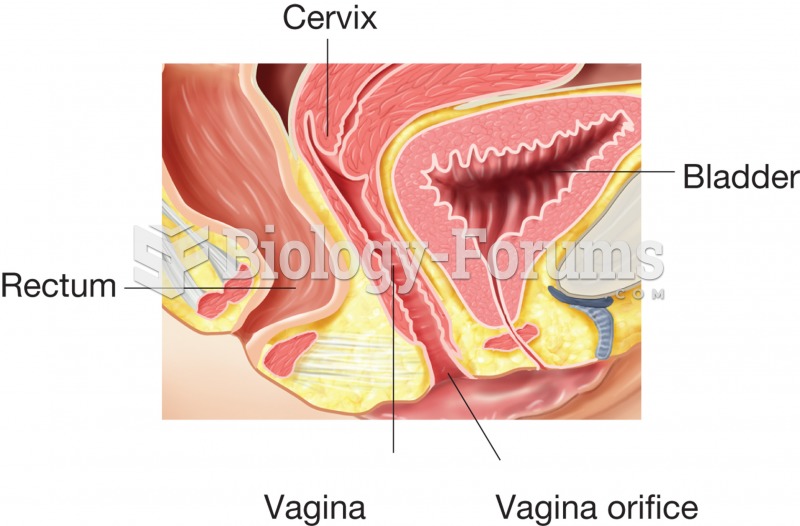 The vagina, sagittal section showing the location of the vagina and its relationship to the cervix,
 Young adults usually grieve loss of a role, such as employment or the breakup of a relationship.
 Fall
Fall
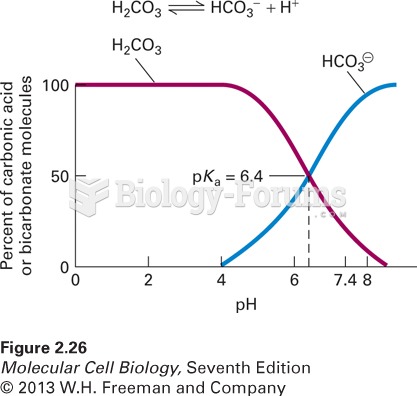 The relationship between pH, pKa, and the dissociation of an acid
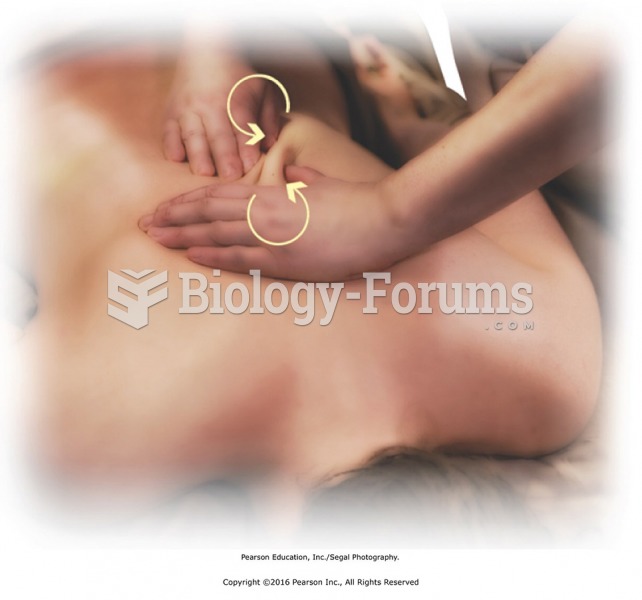 Apply two-hand petrissage over the entire upper back. Place palms flat on back next to each other. ...