|
|
|

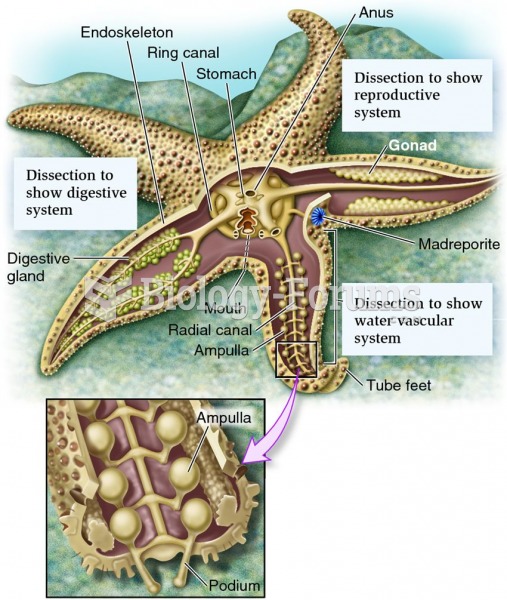 Body plan of an echinoderm, as represented by a sea star.
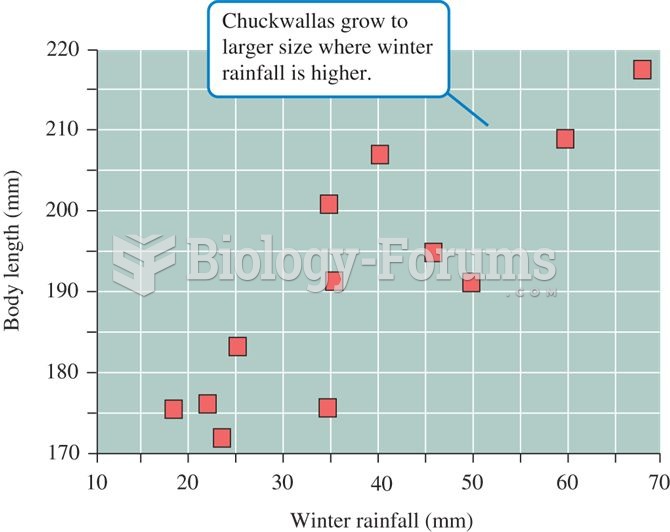 Relationship between winter rainfall and chuckwalla, Sauromalus, size
 Phases of the working relationship
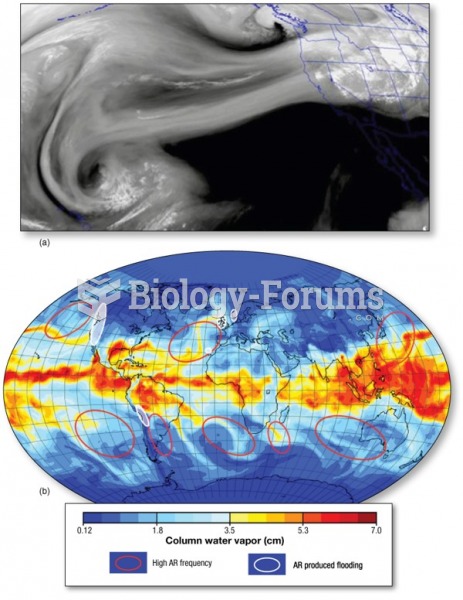 The Upper Troposphere: Atmospheric Rivers
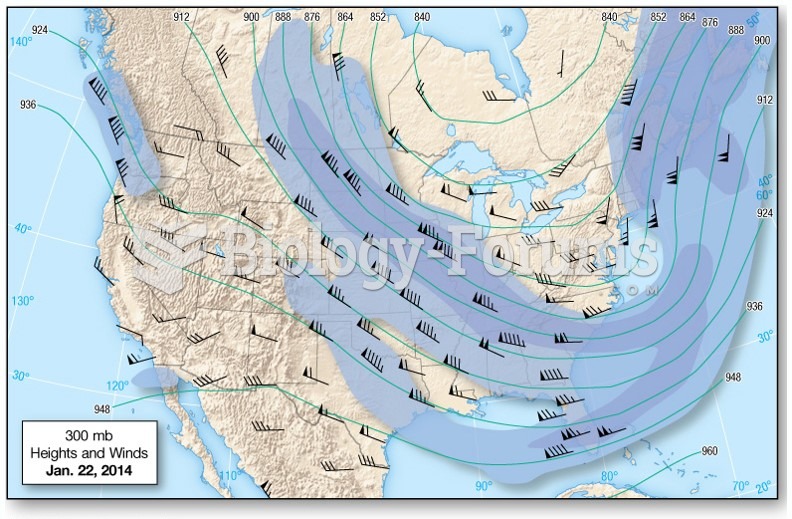 Upper-Level Maps
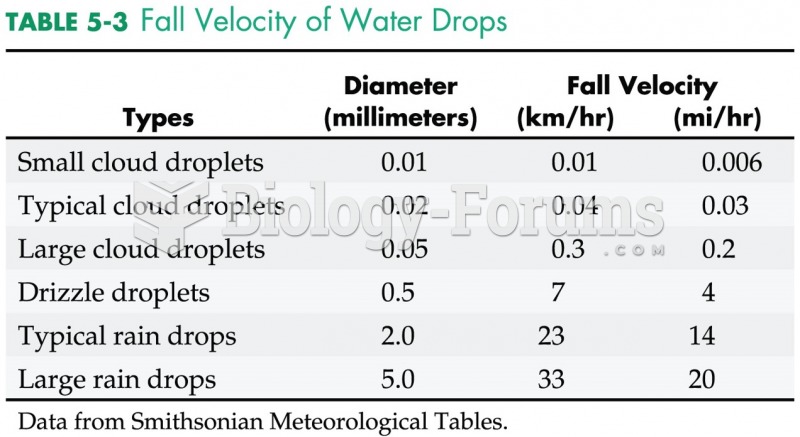 Fall Velocity of Water Drops