This topic contains a solution. Click here to go to the answer

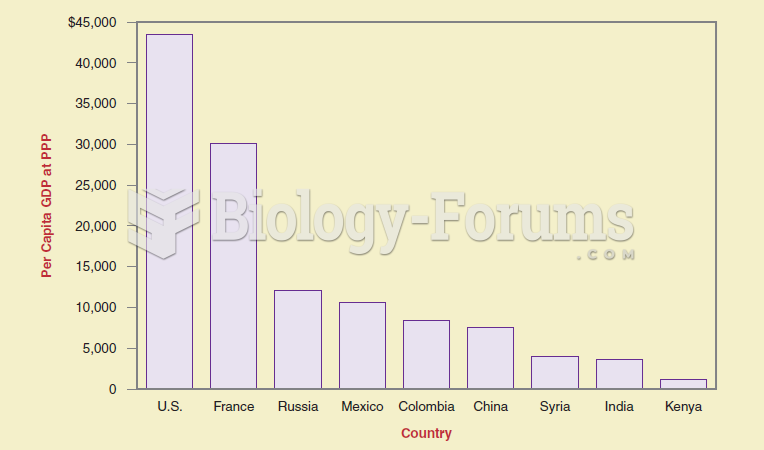
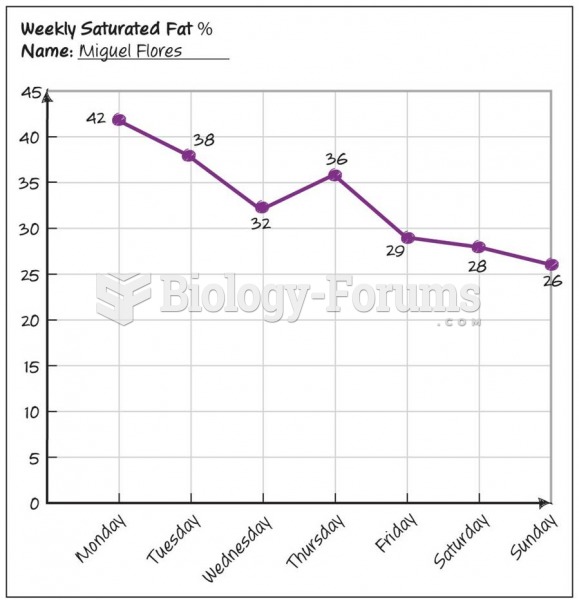
Author Question: If you graph data, you might be able to catch errors that are more difficult to catch when data is ... (Read 52 times)

lbcchick

  • Hero Member
  • *****
  • Posts: 550
If you graph data, you might be able to catch errors that are more difficult to catch when data is simply displayed as numbers.
 
  Indicate whether the statement is true or false

Question 2

________ can be added to a presentation to add visual effects that help convey a concept, add humor, or create interest.
 
  A) Placeholders
 
  B) Clip art
 
  C) Tables
 
  D) Titles


Related Topics

Need homework help now?

Ask unlimited questions for free

Ask a Question
Marked as best answer by a Subject Expert

billybob123

  • Sr. Member
  • ****
  • Posts: 336
Answer to Question 1

TRUE

Answer to Question 2

B


lbcchick

  • Member
  • Posts: 550
Reply 2 on: Aug 29, 2018
Wow, this really help


xiaomengxian

  • Member
  • Posts: 311
Reply 3 on: Yesterday
Great answer, keep it coming :)


Did you know?

Warfarin was developed as a consequence of the study of a strange bleeding disorder that suddenly occurred in cattle on the northern prairies of the United States in the early 1900s.

Did you know?

The modern decimal position system was the invention of the Hindus (around 800 AD), involving the placing of numerals to indicate their value (units, tens, hundreds, and so on).

Did you know?

Asthma cases in Americans are about 75% higher today than they were in 1980.

Did you know?

More than nineteen million Americans carry the factor V gene that causes blood clots, pulmonary embolism, and heart disease.

Did you know?

Acetaminophen (Tylenol) in overdose can seriously damage the liver. It should never be taken by people who use alcohol heavily; it can result in severe liver damage and even a condition requiring a liver transplant.

For a complete list of videos, visit our video library