This topic contains a solution. Click here to go to the answer
|
|
|

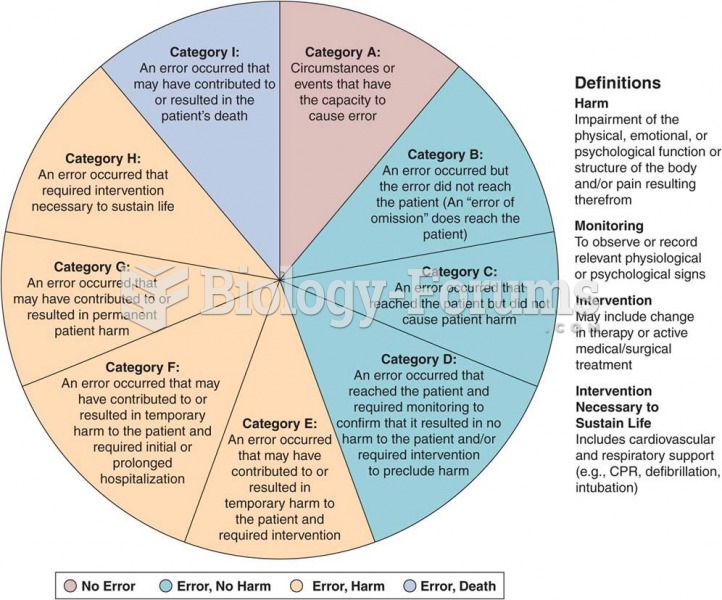 NCC MERP Index for Categorizing Medication Errors
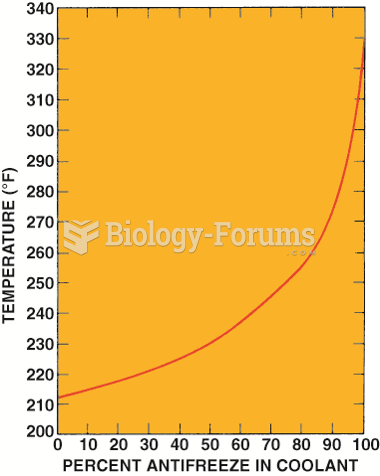 Graph showing how the boiling point of the coolant increases as the percentage of antifreeze in ...
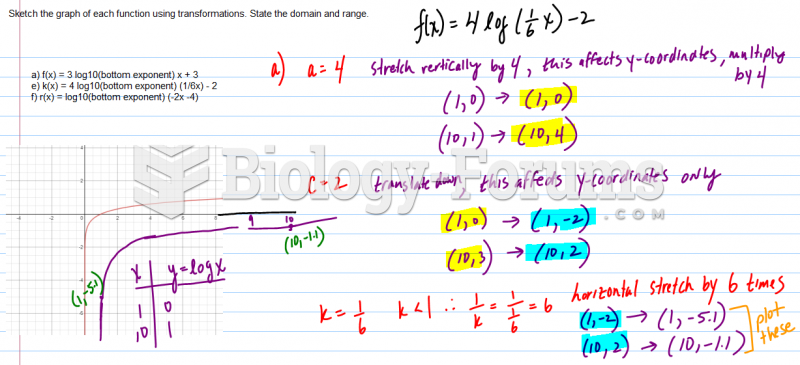 Sketch the graph of each function using transformations. State the domain and range.
 graph
graph
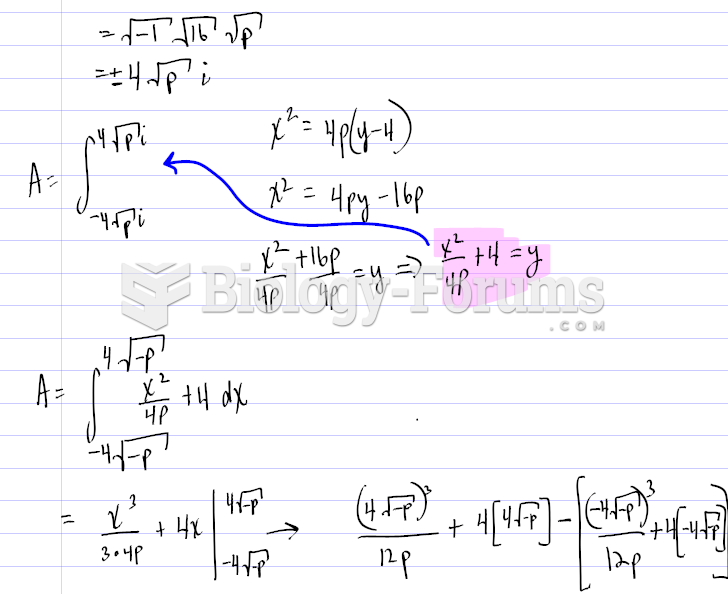 Finding the graph of a Parabola using certain values
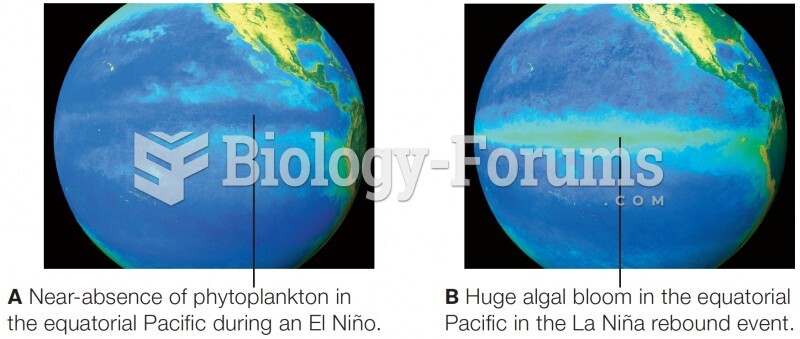 Satellite data on primary productivity in the equatorial Pacific Ocean