This topic contains a solution. Click here to go to the answer
|
|
|

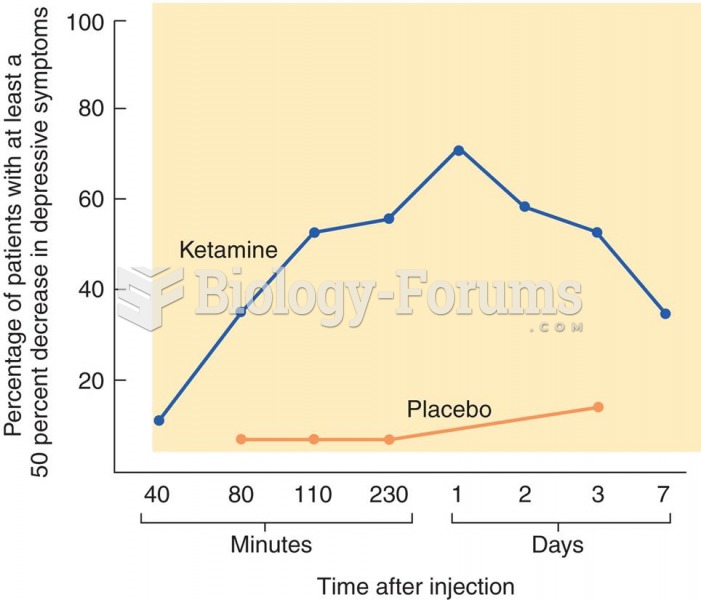 Treatment of Depression with Ketamine The graph shows the effects of ketamine on symptoms of depress
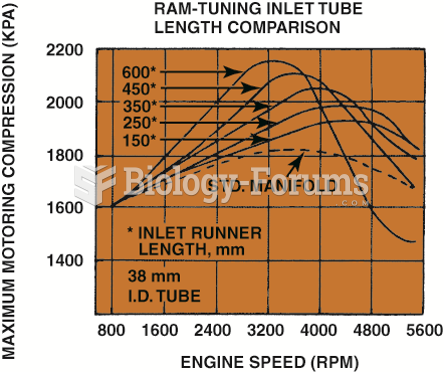 The graph shows the effect of sonic tuning of the intake manifold runners. The longer runners ...
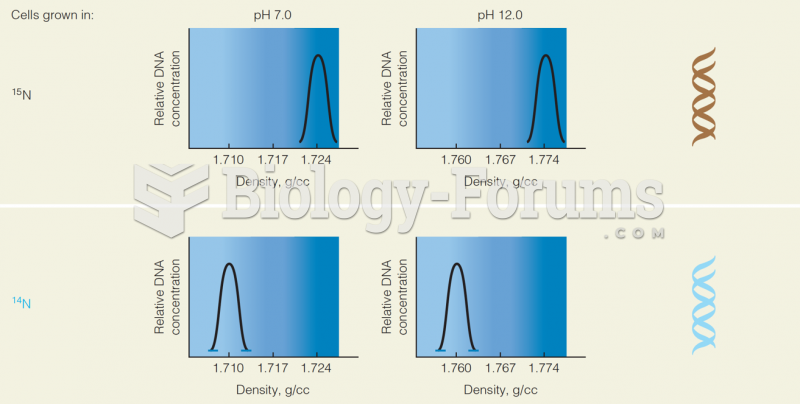 Cell Grown in 15N and 14 N: Graph of Relative DNA Concentration Vs. the Density
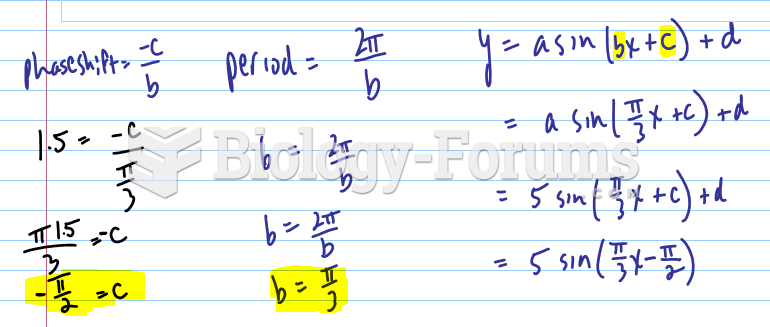 Sketch a graph of the function h(x), by hand on the following interval:
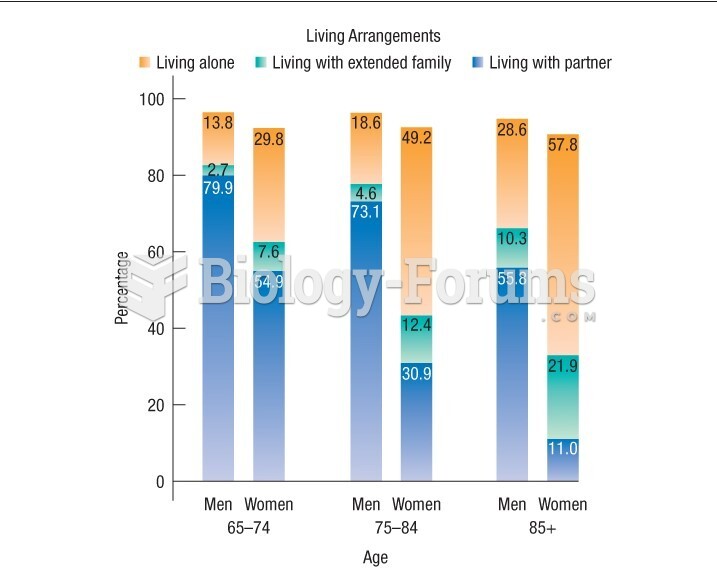 Graph shows the living arrangements of Canadian seniors
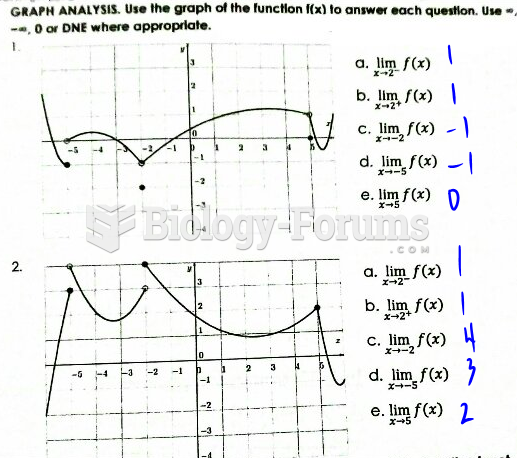 Use the graph of the function f(x) to answer each question.