This topic contains a solution. Click here to go to the answer
|
|
|

 A physician uses a portable electronic tablet to enter patient data while in the examination room.
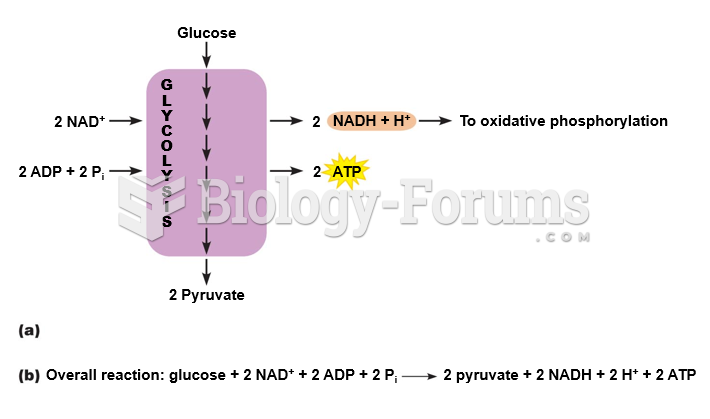 Summary of glycolysis.
 Summary of the Krebs cycle.
 How to create a frequency table and histogram from raw data
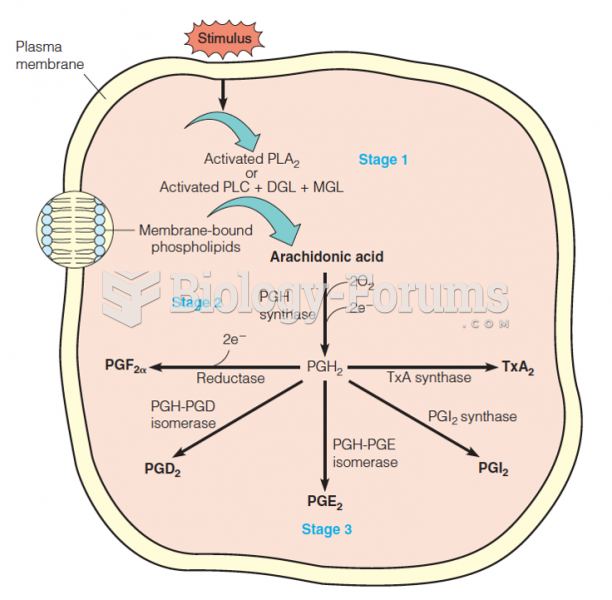 Summary of biosynthetic routes to the major prostaglandins and thromboxane A2
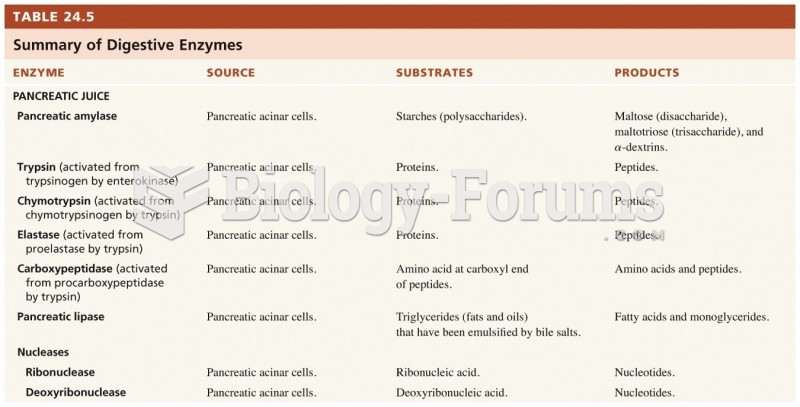 Summary of the digestive enzymes