This topic contains a solution. Click here to go to the answer
|
|
|

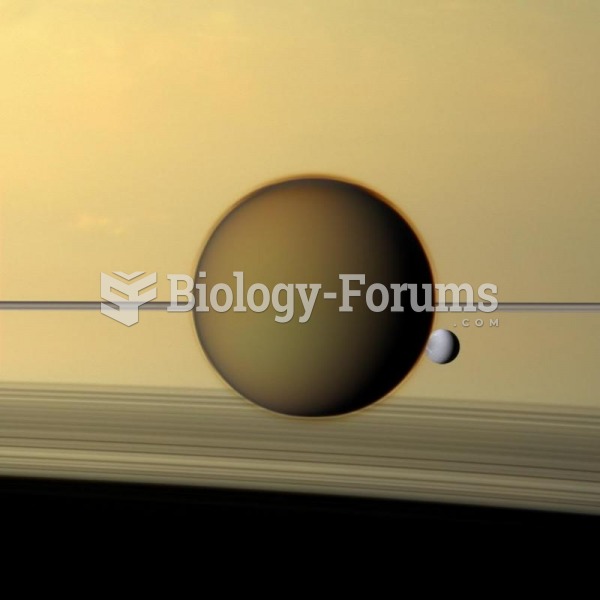 Titan's dense atmosphere shrouds the moon beneath a tan haze in this image.
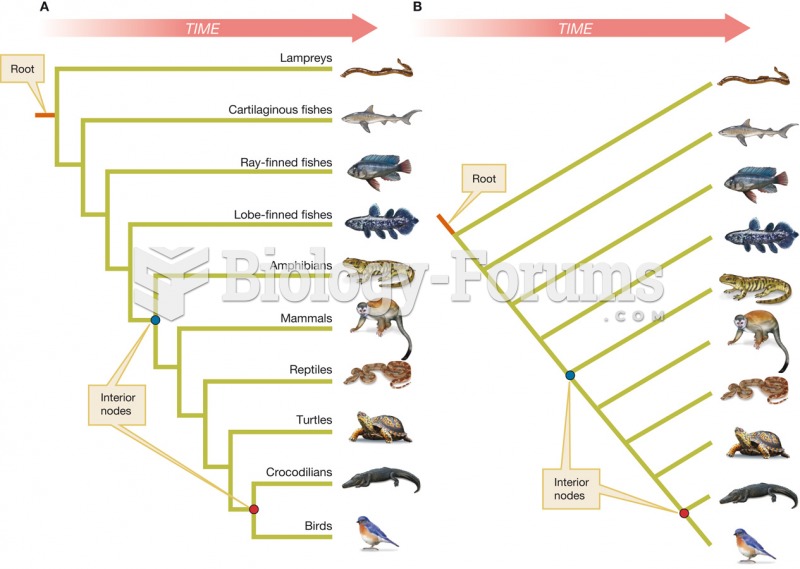 Two equivalent ways of drawing a phylogeny
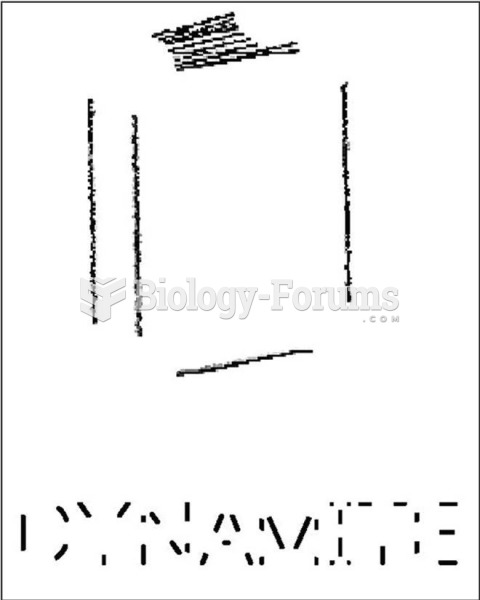 Object and Word Recognition After Vertices Have Been Eliminated (Adapted from Szwed, M., Cohen, L, Q
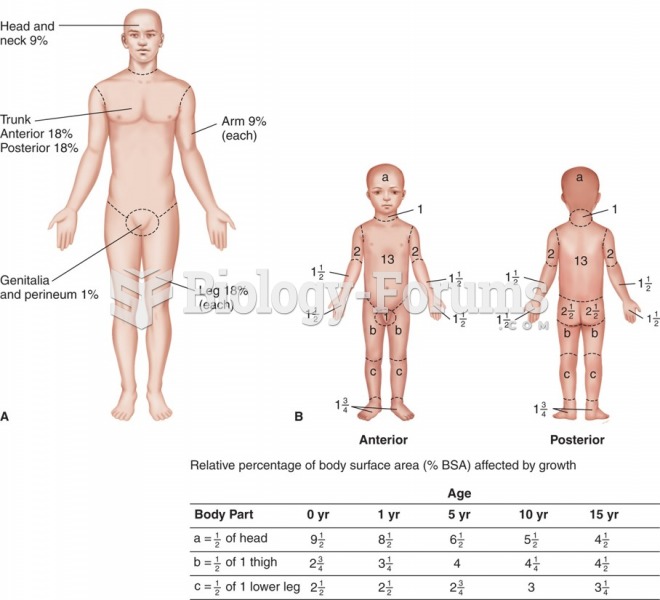 Determining the extent of a burn: (A) rule of nines (adults); (B) Lund-Browder chart (children).
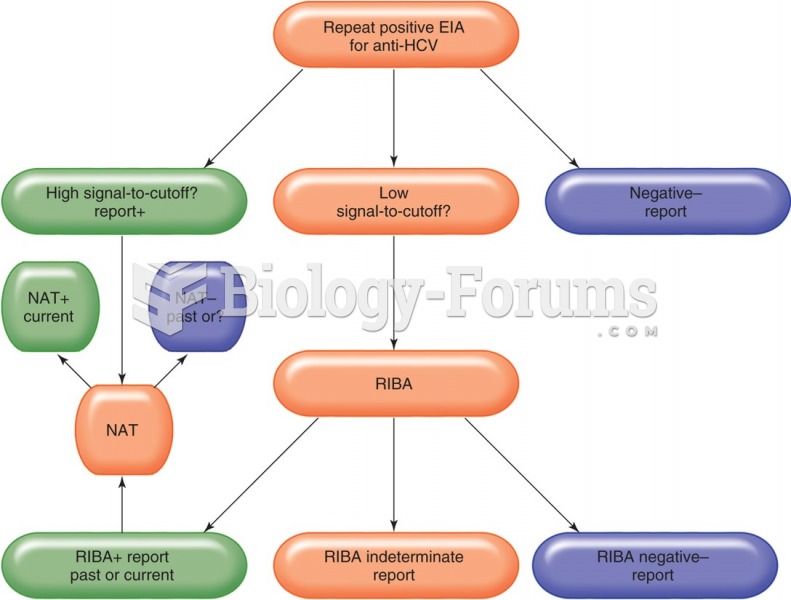 Flow chart for the diagnosis of hepatitis C. Hepatitis C reporting using the signal-tocutoff ratio.
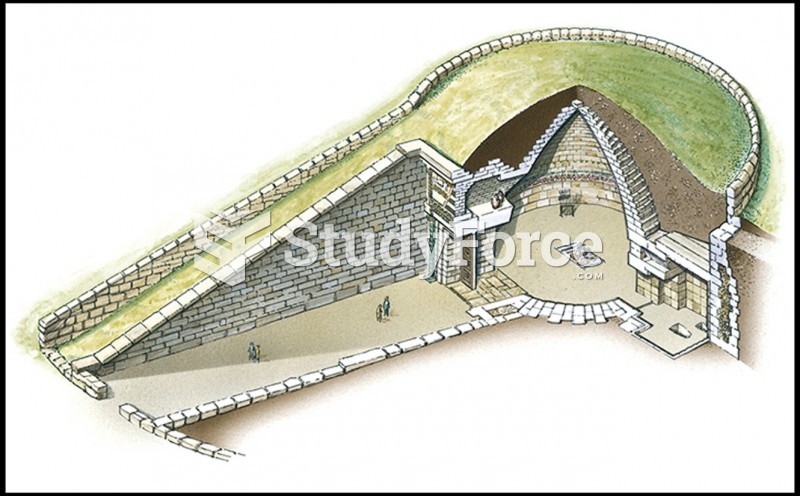 Cutaway Drawing of Tholos, The So-called Treasury of Atreus