This topic contains a solution. Click here to go to the answer
|
|
|

 Burmese colored gerbil
 Two parti-colored Abyssinian guinea pigs
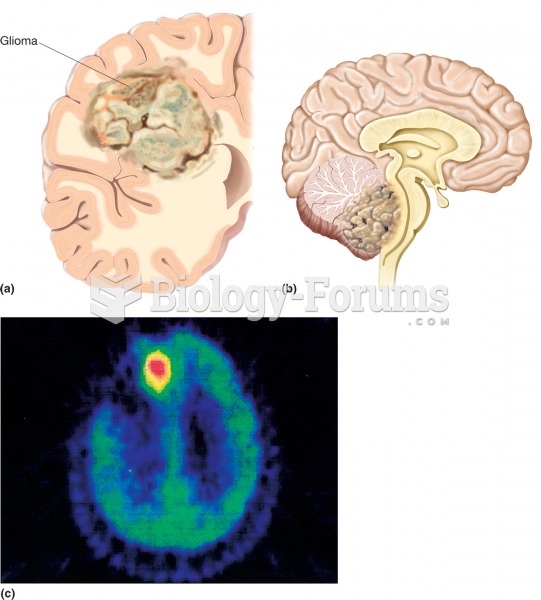 Glioma. (a) Illustration of a large glioma (colored area) within the left cerebral hemisphere in a s
 Example of a Medicare Electronic Remittance Advice (ERA).
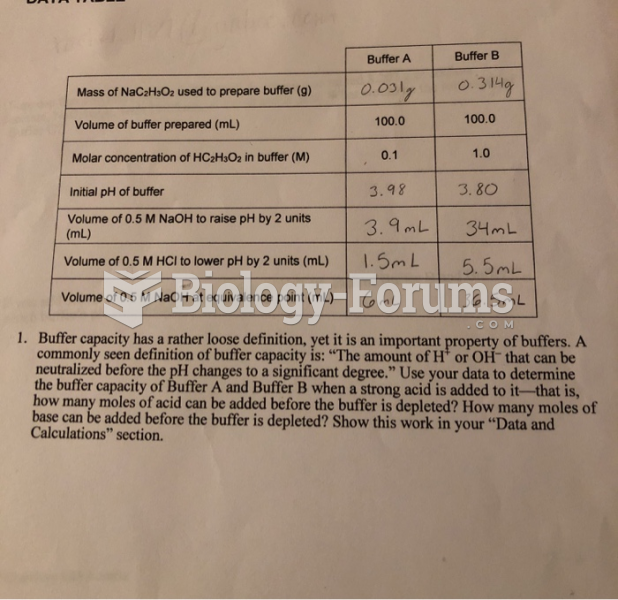 Buffer Lab help+advice?
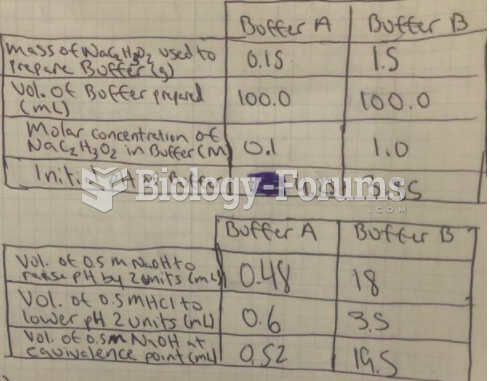 Buffer Lab help+advice?