This topic contains a solution. Click here to go to the answer
|
|
|

 A parti-colored guinea pig suffering from torticollis, or wry neck
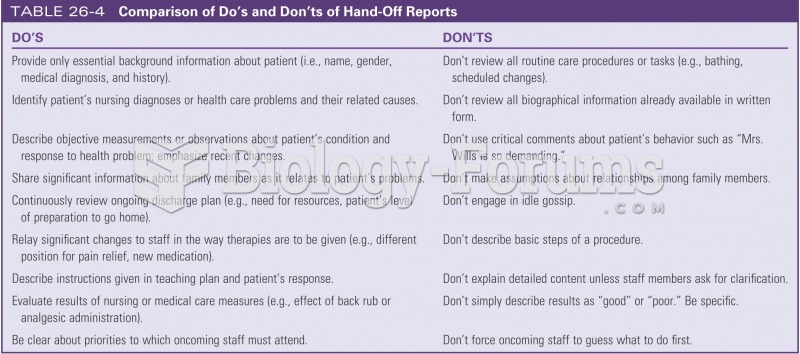 Comparison of do's and dont's of hand-off reports
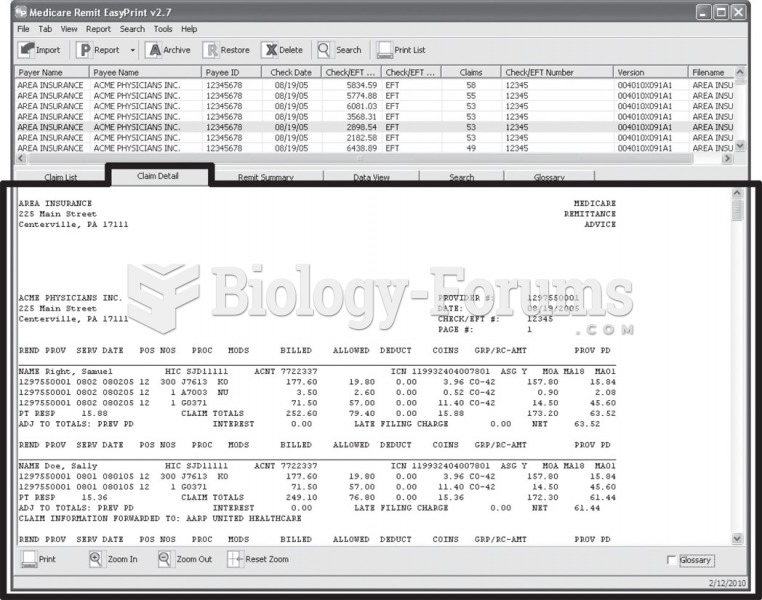 Example of a Medicare Electronic Remittance Advice (ERA).
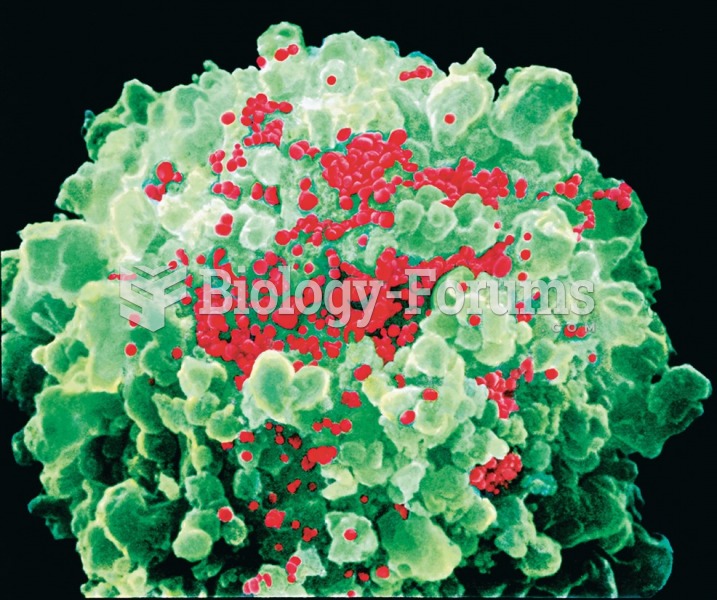 Colored scanning electron micrograph (SEM) of a helper T cell (green) with HIV viruses (red) budding ...
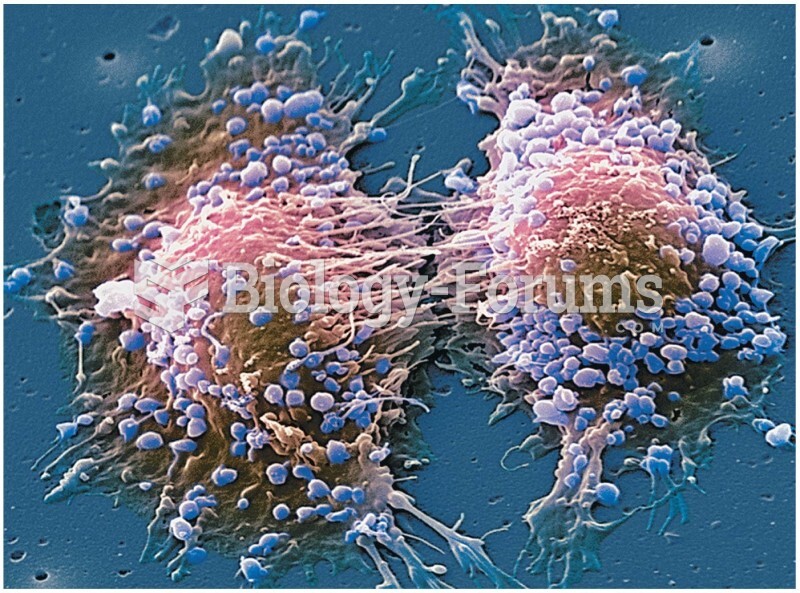 Opener Colored scanning electron micrograph of two prostate cancer cells in the final stages of cell
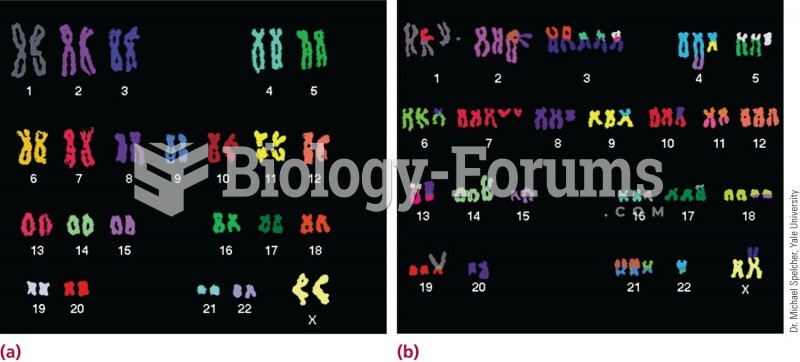 (a) Chromosome painting with five different-colored markers in a normal cell. (b) Painting produces