|
|
|

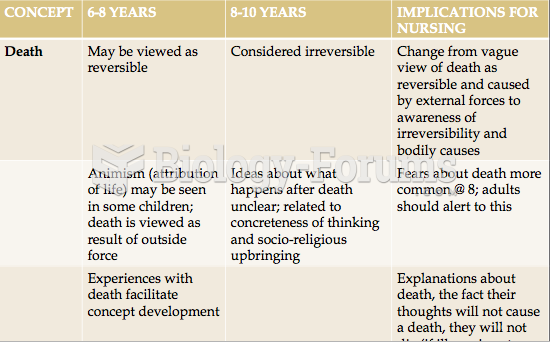 Concept of Death by Children
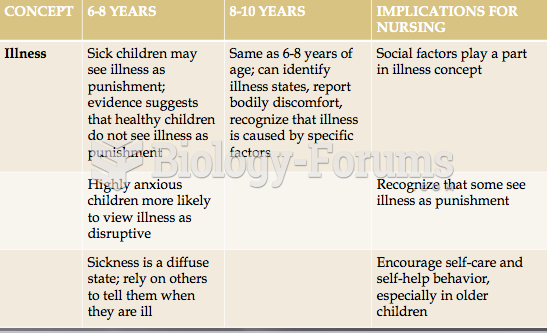 Concept of Illness by Children
 Young children typically are boundlessly curious about the world around them.
 How difficult is it for children to learn to speak two languages?
 Everyday situations sometimes present opportunities for children to build information processing ...
 Family structure is a vital aspect in the socialization of children.