This topic contains a solution. Click here to go to the answer
|
|
|

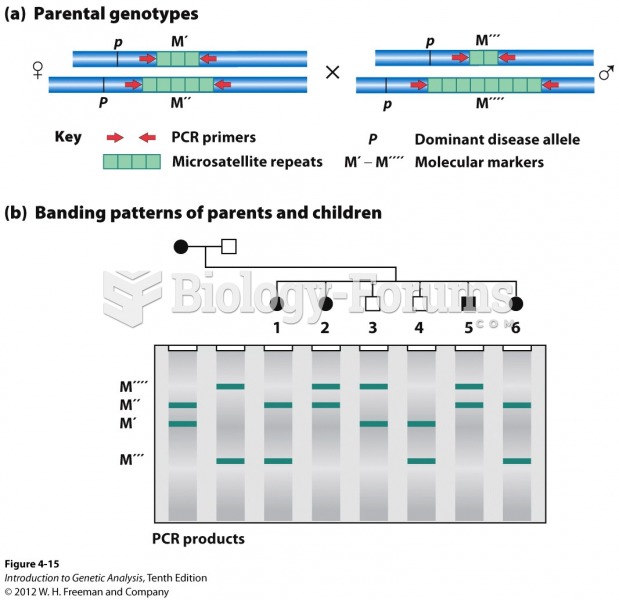 A microsatellite locus can show linkage to a disease gene
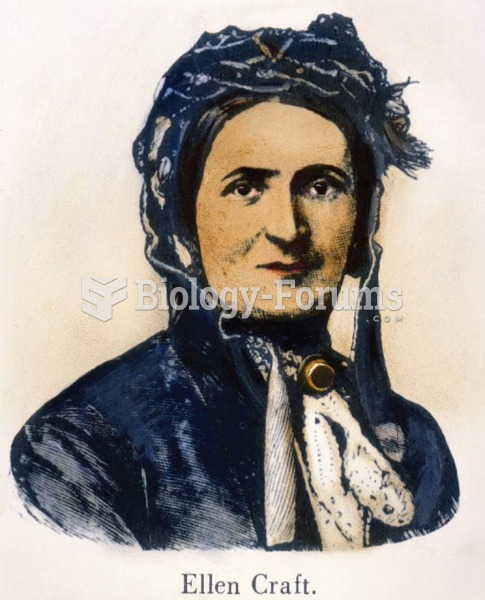 These illustrations show Ellen Craft, a slave with and without a disguise. She dressed “as a disting
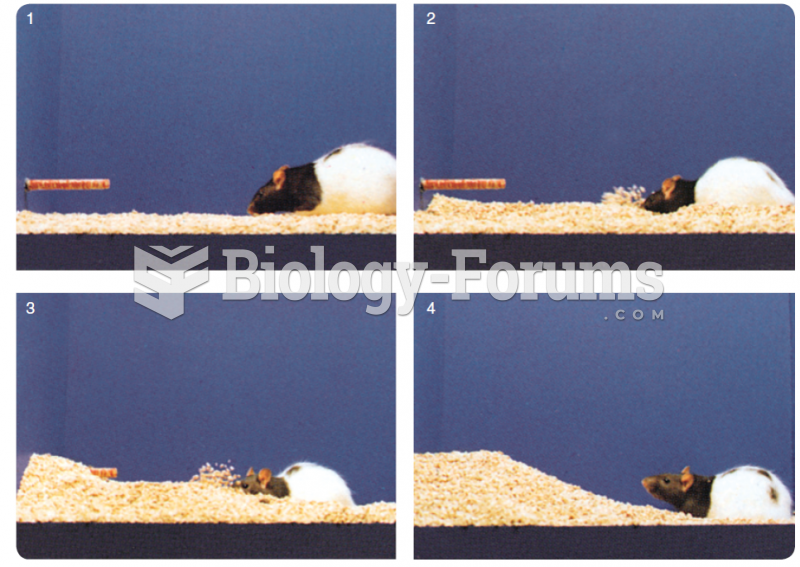 These photos show a rat burying a test object from which it has just received a single mild shock.
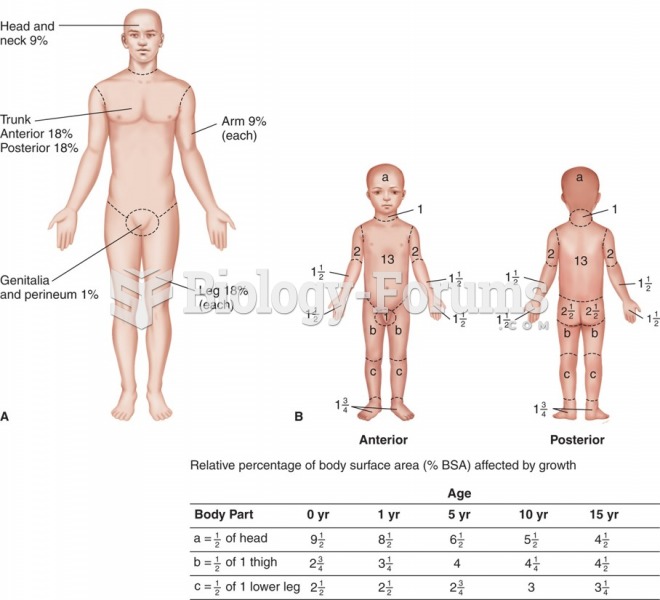 Determining the extent of a burn: (A) rule of nines (adults); (B) Lund-Browder chart (children).
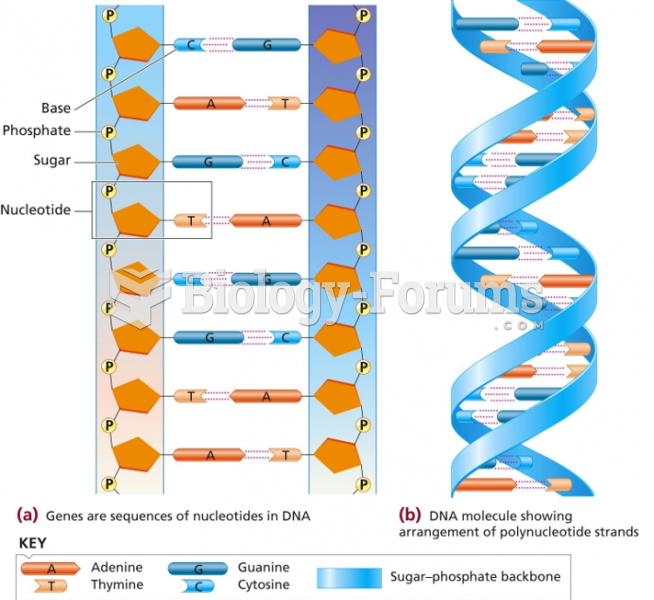 Genes are composed of a sequence of nucleotides in a DNA molecule
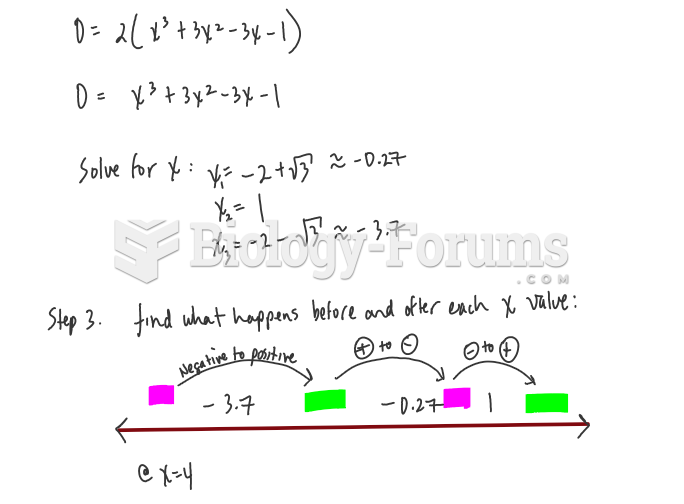 Calculus help: Show that y has three points of inflection and they all lie on...