This topic contains a solution. Click here to go to the answer
|
|
|

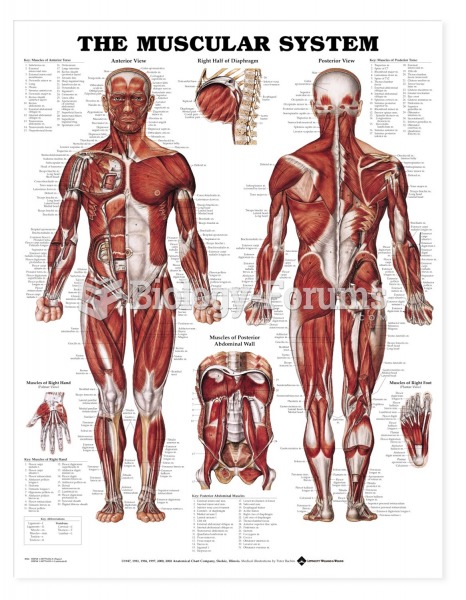 Anatomical Charts Muscular System
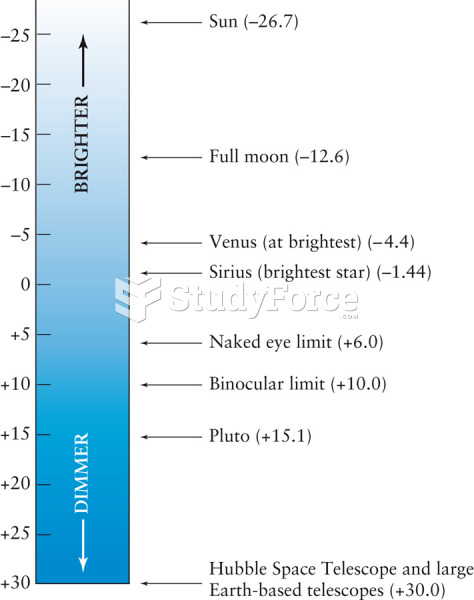 Apparent Magnitude Scale
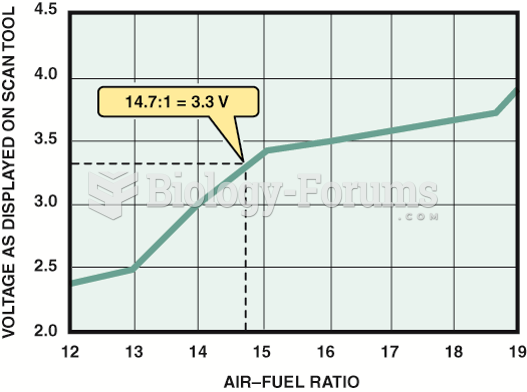 The scan tool can display various voltage but will often show 3.3 volts because the PCM is ...
 Horizontal stroking to thigh from superior to inferior. Lift tissues as hands cross over top of ...
 Vector has a magnitude of 5.5 cm and points along the x-axis. Vector has a magnitude of ...
 Variable expression of yellow phenotype in mice caused by diet-related epigenetic changes in the gen