This topic contains a solution. Click here to go to the answer
|
|
|

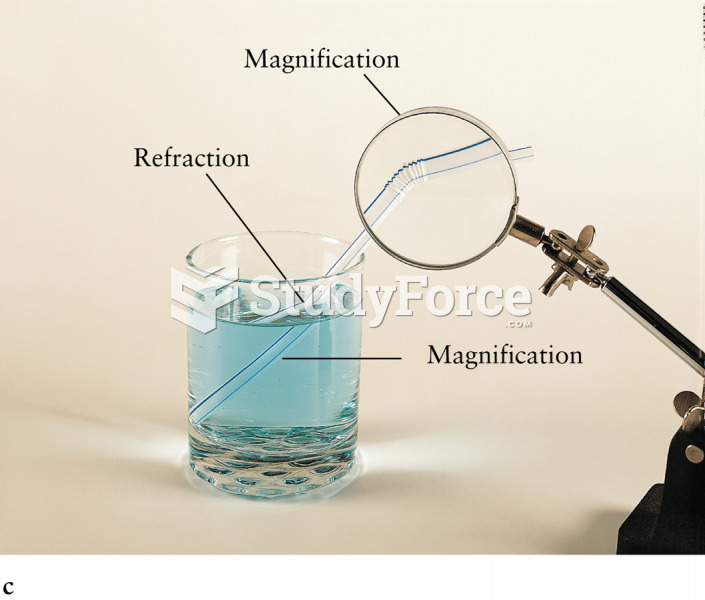 Refraction Through Uniform and Variable Thickness Glasses
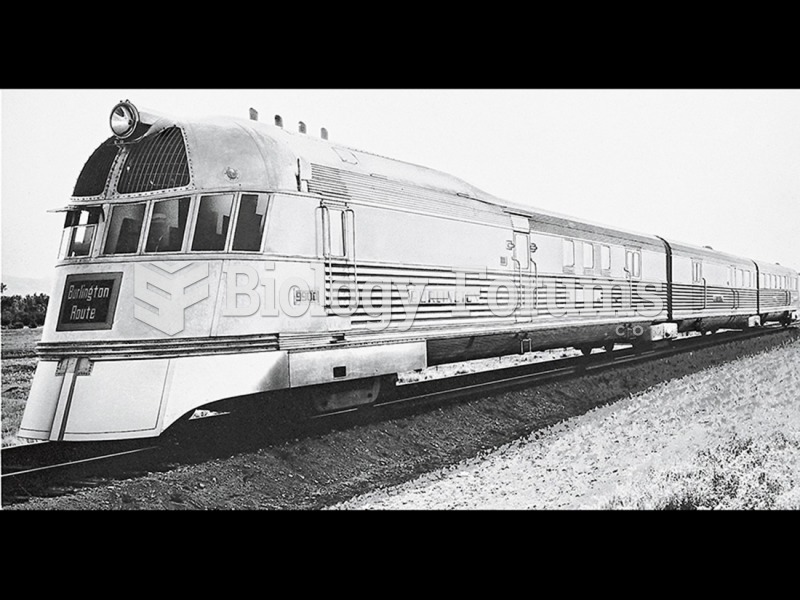 Chrysler Salon, N. Y. C., showing the 1937 Chrysler Airflow four-door sedan on display in the ...
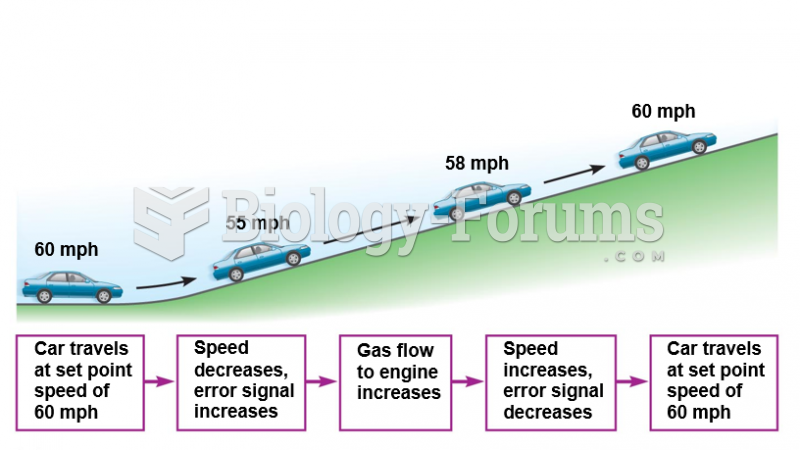 Negative feedback control of a regulated variable.
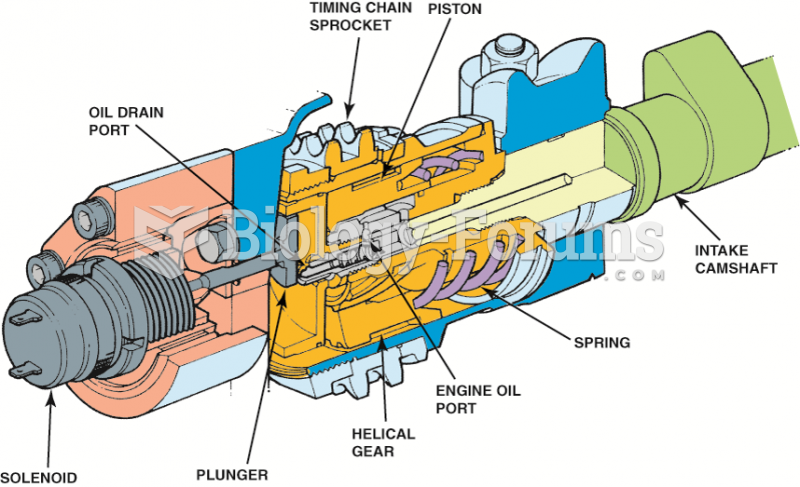 A typical variable cam timing control valve. The solenoid is controlled by the engine computer and ...
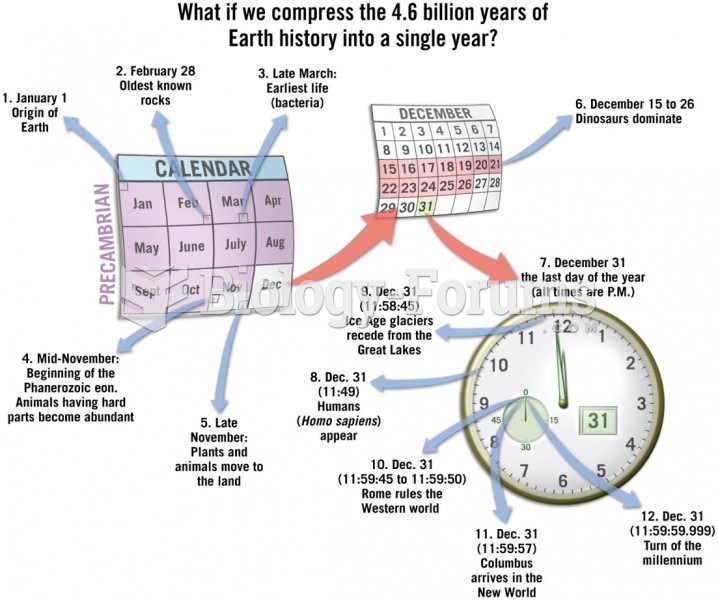 Magnitude of Geologic Time
 Quantitative trait locus (QTL) detection and mapping