This topic contains a solution. Click here to go to the answer
|
|
|

 The paleoanthropologist must understand these deformations in order to figure out which strata a fos
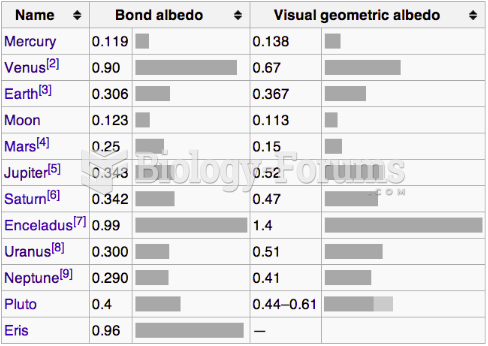 Albedo Chart
 Sketch the graph of each function using transformations. State the domain and range.
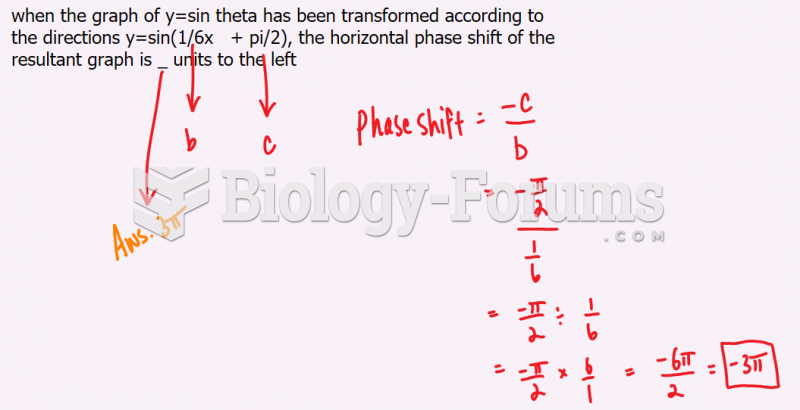 The horizontal phase shift of the resultant graph is
 Sketch the graph using the tables providing. Determine if each function is continuous or ...
 Finding the graph of a Parabola using certain values