This topic contains a solution. Click here to go to the answer
|
|
|

 All messages must be documented and placed in the patient's chart.
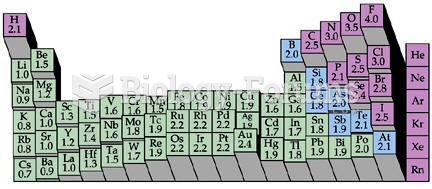 Electronegativity Chart (Periodic Table)
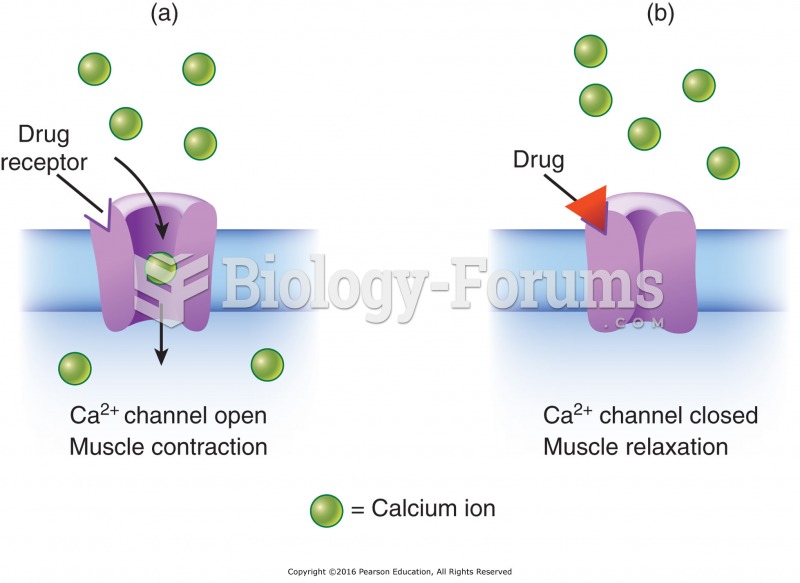 L-type calcium channel: (a) Calcium channel opens when an action potential passes across the ...
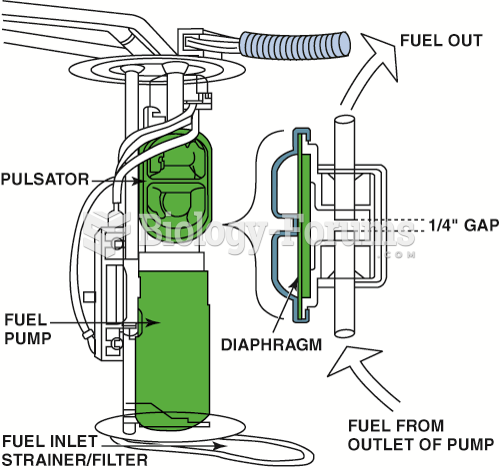 A typical fuel pulsator used mostly with roller vane-type pumps to help even out the pulsation in ...
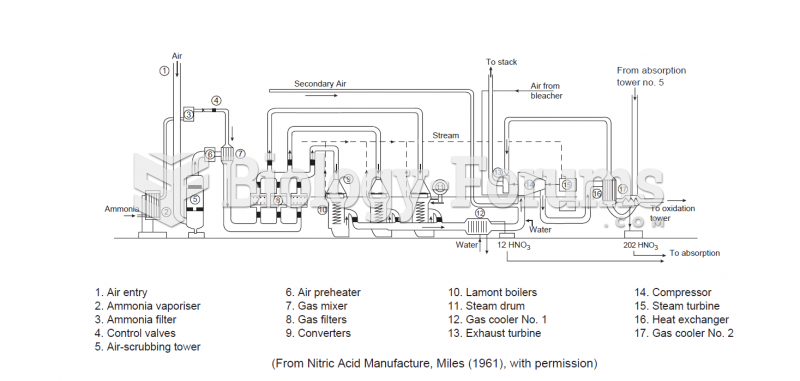 Connections of a nitric acid plant, intermediate pressure type
 Satellite data showing net primary production. Productivity is coded as red (highest) down through o