|
|
|

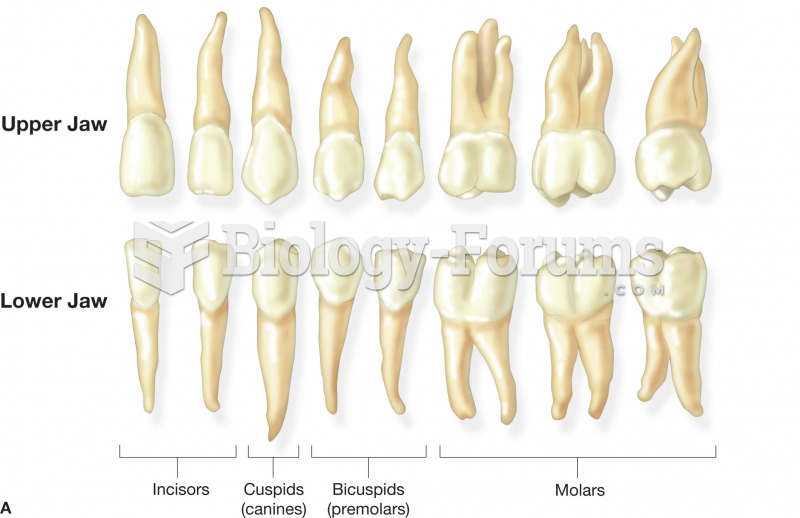 (A) The name and shape of the adult teeth. These teeth represent those found in the right side of th
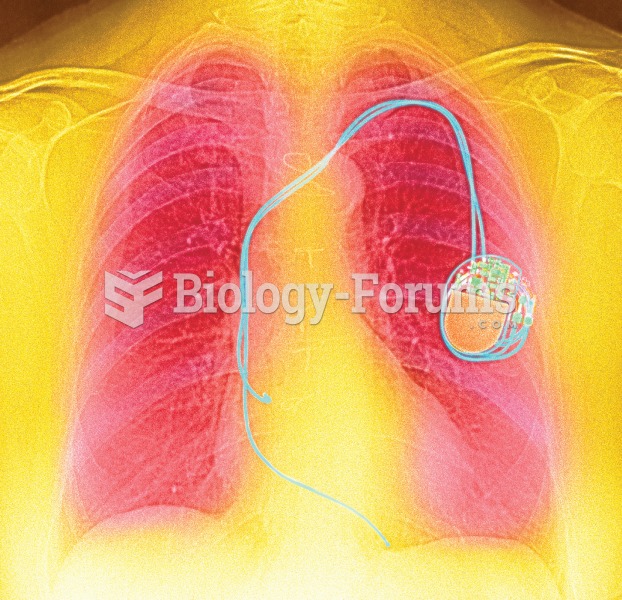 Color enhanced X-ray showing a pacemaker implanted in the left side of the chest and the electrode w
 Refraction Through Uniform and Variable Thickness Glasses
 HIV-positive men with a high number of life stressors progress more quickly to AIDS than those with ...
 Starting at the waist, apply circular two-handed petrissage over the entire right side. Keep hands ...
 Typical Startup Cost Categories Cont.