|
|
|

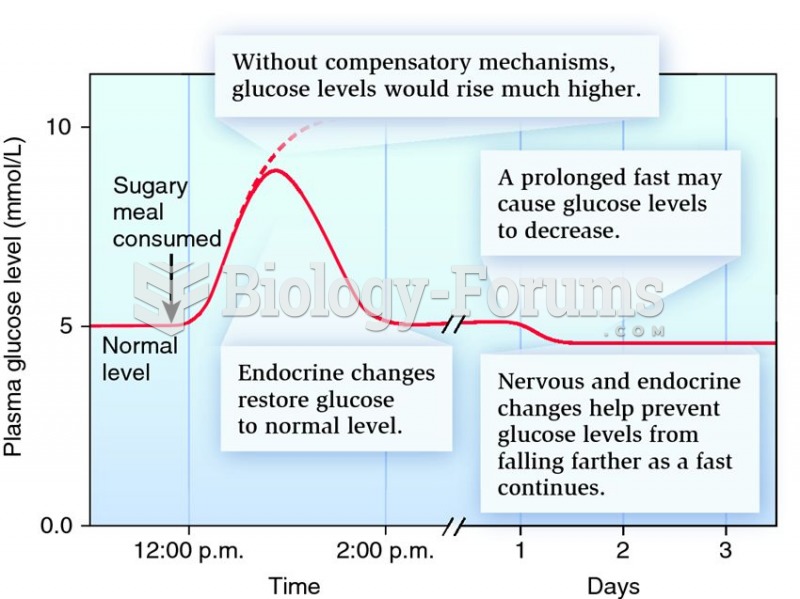 An example of a homeostatically controlled variable: blood levels of glucose in a human.
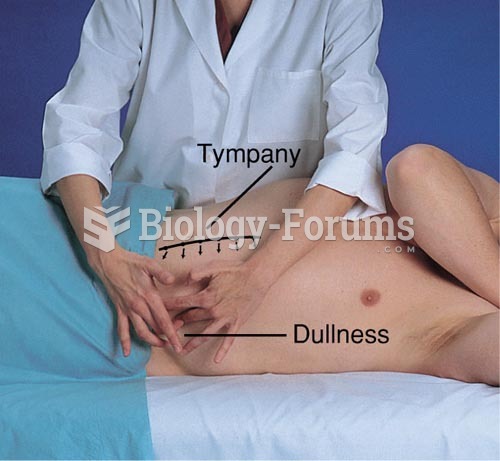 Percussion for Ascites: Shifting Dullness, Patient on Left Side
 The letters on the side of this injector on a Cummins 6.7 liter diesel indicate the calibration ...
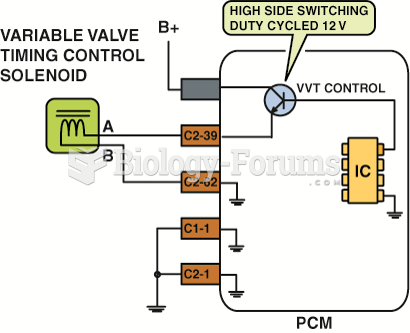 A variable valve timing solenoid being controlled by applying voltage from the PCM.
 How to solve a linear system when the variable is in the denominator position (Question 2 of 2)