This topic contains a solution. Click here to go to the answer
|
|
|

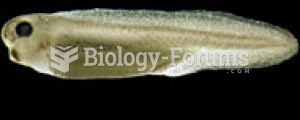 The Xenopus frog tadpole is a small, simple vertebrate.
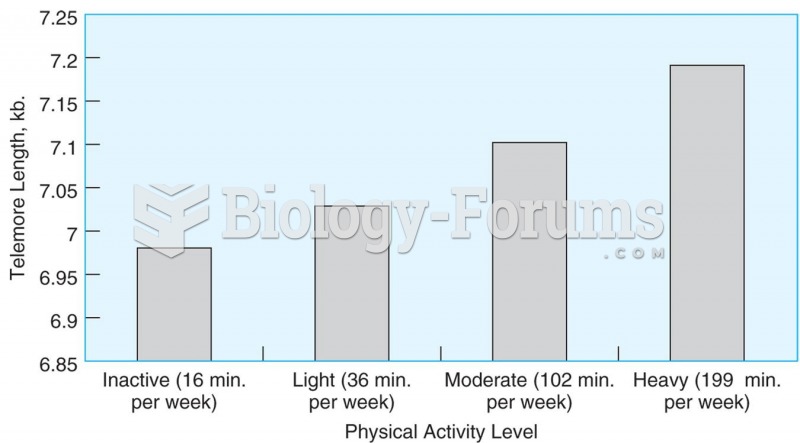 Telomere length is related to the amount of time adults spend in leisure time activity. Source: Ada
 Small Town USA: Struggling to Survive
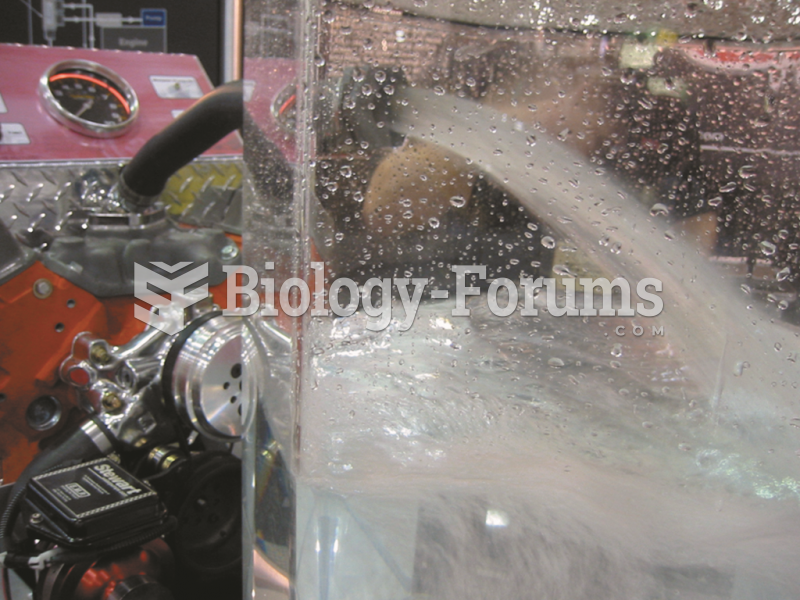 A demonstration engine showing the amount of water that can be circulated through the cooling ...
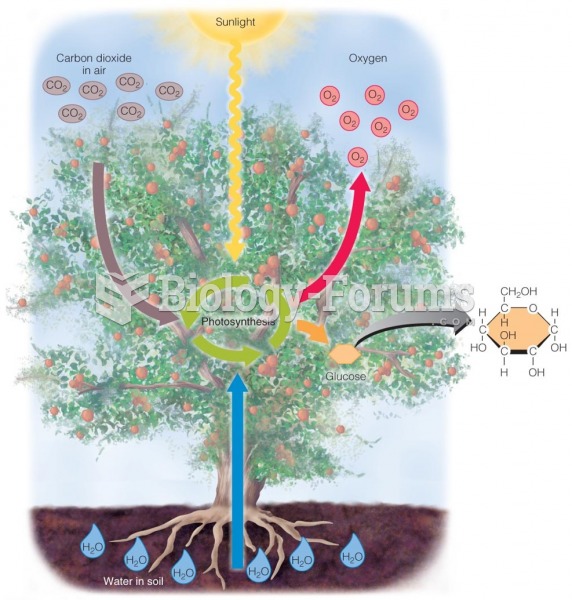 Photosynthesis: How Glucose Is Made During photosynthesis, the leaves of green plants absorb
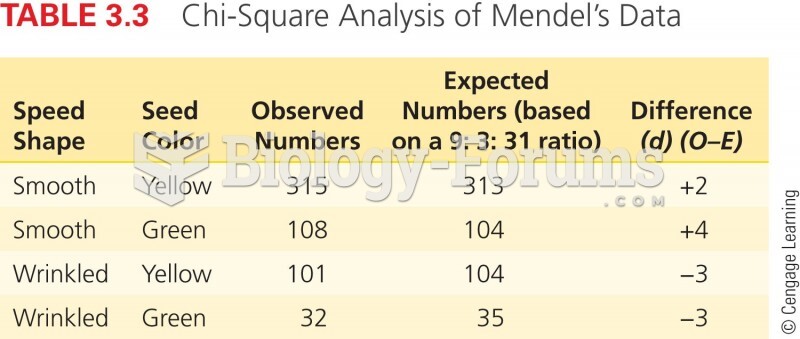 Chi-Square Analysis of Mendel's Data