This topic contains a solution. Click here to go to the answer
|
|
|

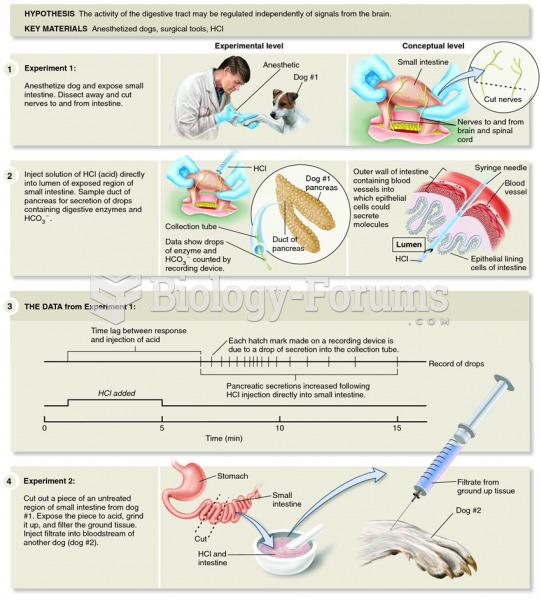 Bayliss and Starling discovered the mechanism by which the small intestine and pancreas work togethe
 The carbon cycle. Numbers are storage as 1015 g or fluxes as 1015 g per year (data from Schlesinger
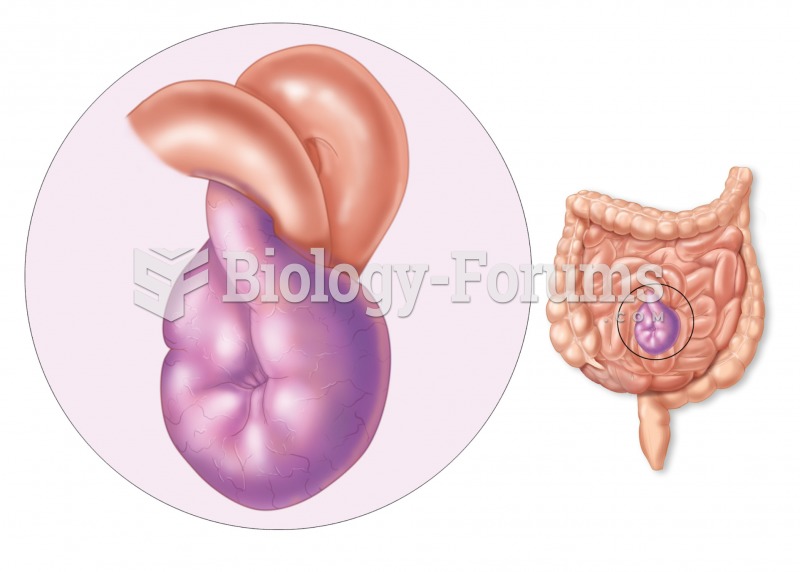 Volvulus. A volvulus results when the small intestine twists, causing an obstruction that can lead t
 Town of nothing
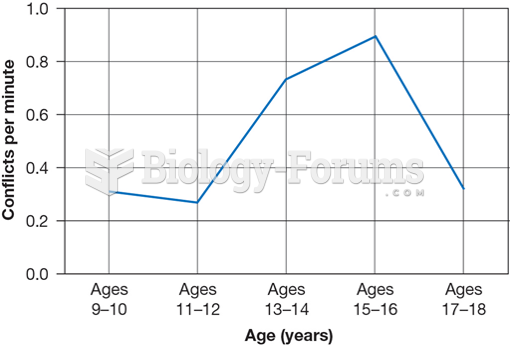 Observed Mother–Child Arguments at Five Time Points Over an Eight-Year Period
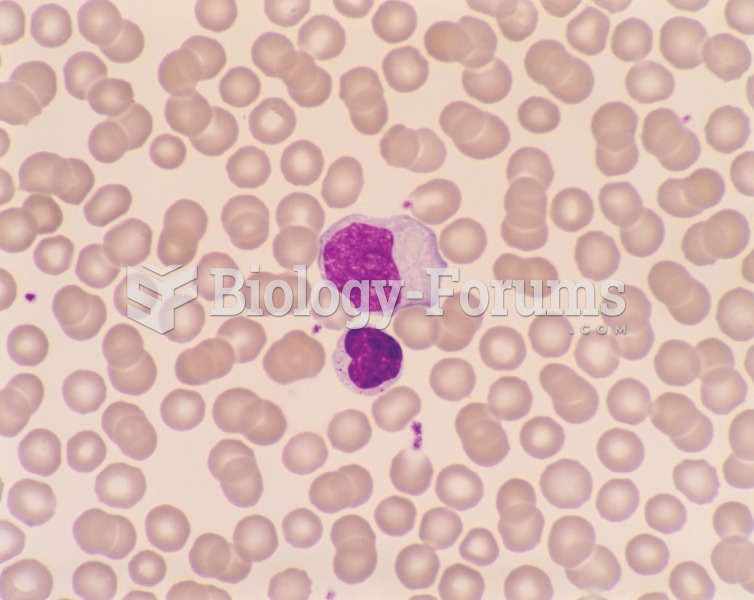 Two lymphocytes that are reactive in a 19-year-old college student with infectious mononucleosis. ...