At a recent meeting, the manager of a national call center for a major Internet bank made the statement that the average past-due amount for customers who have been called previously about their bills is now no larger than 20.00.
Other bank managers at the meeting suggested that this statement may be in error and that it might be worthwhile to conduct a test to see if there is statistical support for the call center manager's statement. The file called Bank Call Center contains data for a random sample of 67 customers from the call center population. Assuming that the population standard deviation for past due amounts is known to be 60.00, what should be concluded based on the sample data? Test using = 0.10.A) Because p-value = 0.4121 > alpha = 0.10, we do not reject the null hypothesis.
The sample data do not provide sufficient evidence to reject the call center manager's statement that the mean past due amount is 20.00 or less.
B) Because p-value = 0.4121 > alpha = 0.10, we reject the null hypothesis.
The sample data provide sufficient evidence to reject the call center manager's statement that the mean past due amount is 20.00 or less.
C) Because p-value = 0.2546 > alpha = 0.10, we do not reject the null hypothesis.
The sample data do not provide sufficient evidence to reject the call center manager's statement that the mean past due amount is 20.00 or less.
D) Because p-value = 0.2546 > alpha = 0.10, we reject the null hypothesis.
The sample data provide sufficient evidence to reject the call center manager's statement that the mean past due amount is 20.00 or less.
Question 2
The U.S. Census Bureau (Annual Social & Economic Supplement) collects demographics concerning the number of people in families per household. Assume the distribution of the number of people per household is shown in the following table:
x P(x)
2 0.27
3 0.25
4 0.28
5 0.13
6 0.04
7 0.03
Calculate the expected number of people in families per household in the United States.
A) 2.71
B) 3.33
C) 3.51
D) 4.33

 Swallow-tailed Bee-eater in Etosha National Park, Namibia
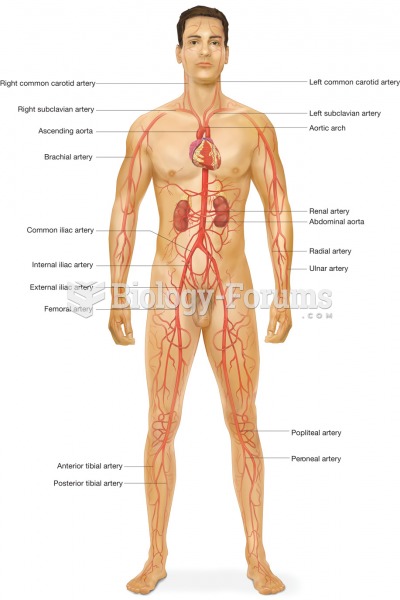 The major arteries of the body.
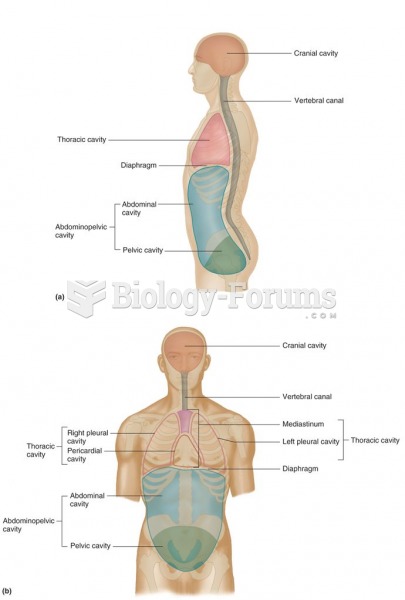 Major Body Cavities
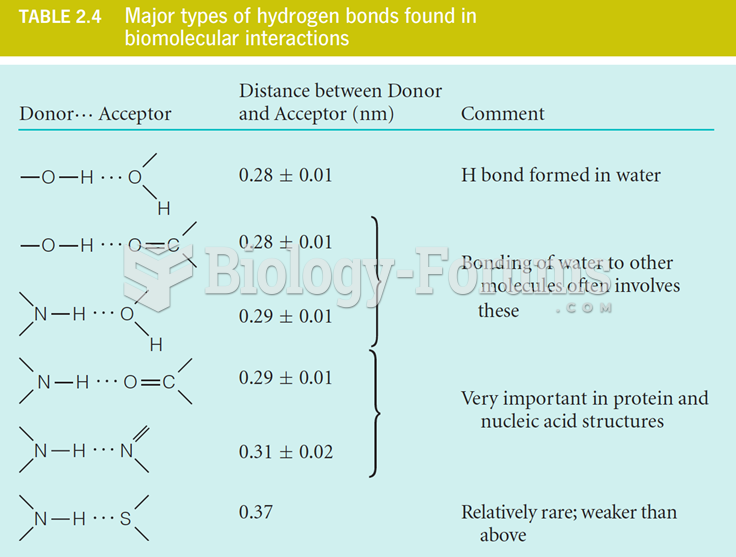 Major Types of Hydrogen Bonds Found in Biomolecular Interactions
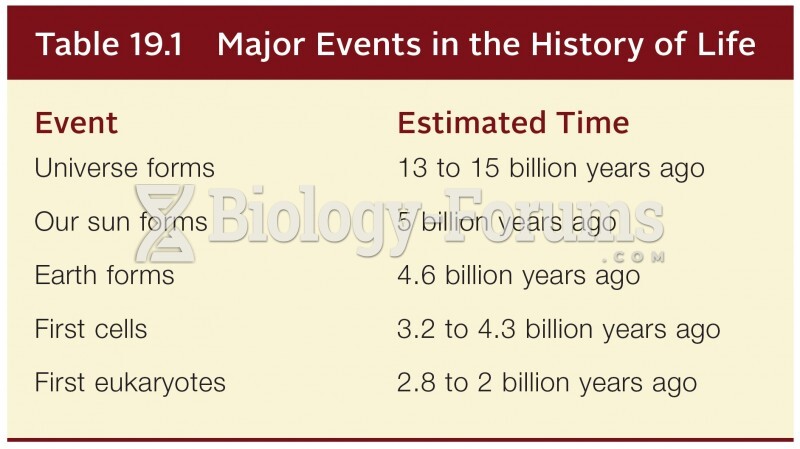 Major Events in the History of Life