This topic contains a solution. Click here to go to the answer
|
|
|

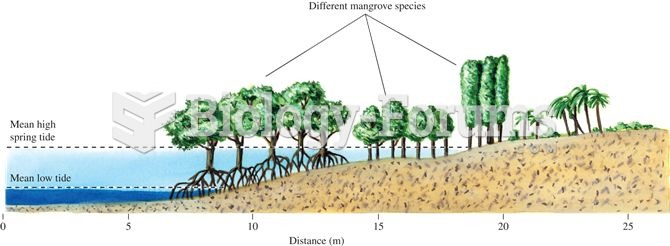 Where mangrove diversity is high, mangrove species show clear patterns of vertical zonation relative
 Neural Tissue Diagram
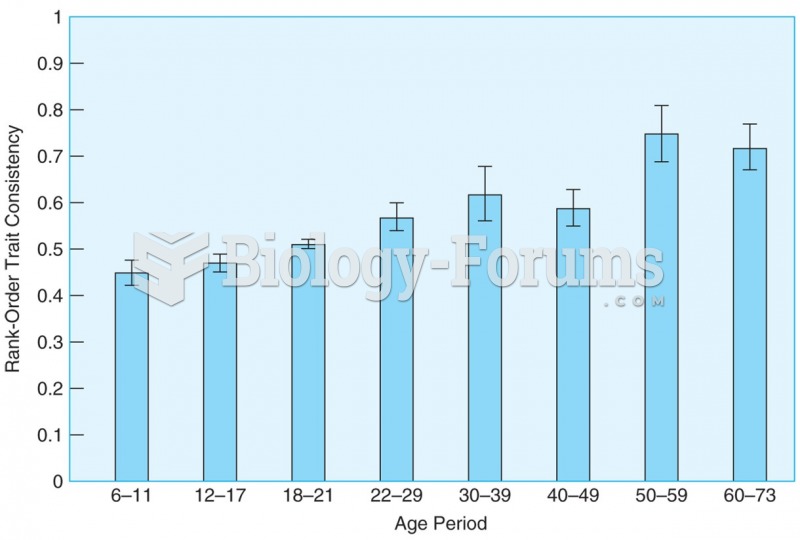 Rank-order correlations show that differential consistency remains high from childhood through late ...
 Discrete random variables- Probability Distribution Function
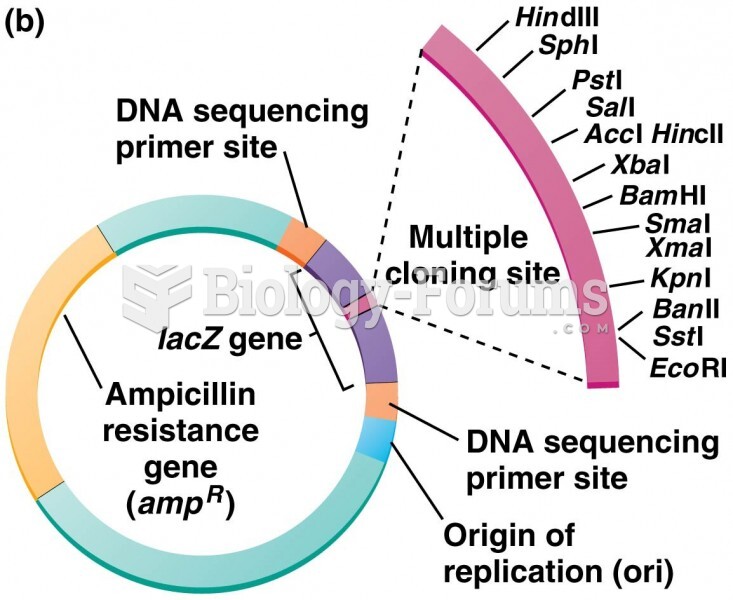 A diagram of a typical DNA cloning plasmid
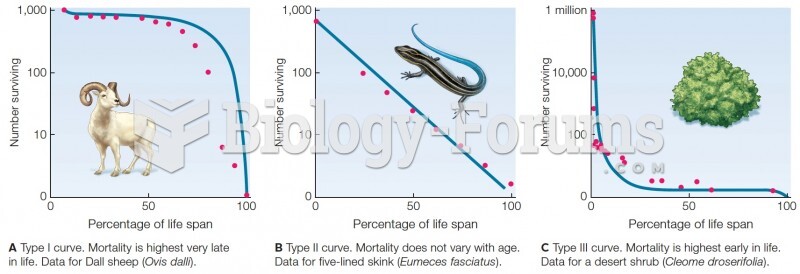 Survivorship curves. Blue lines are theoretical curves. Red dots are data from field studies.