This topic contains a solution. Click here to go to the answer
|
|
|

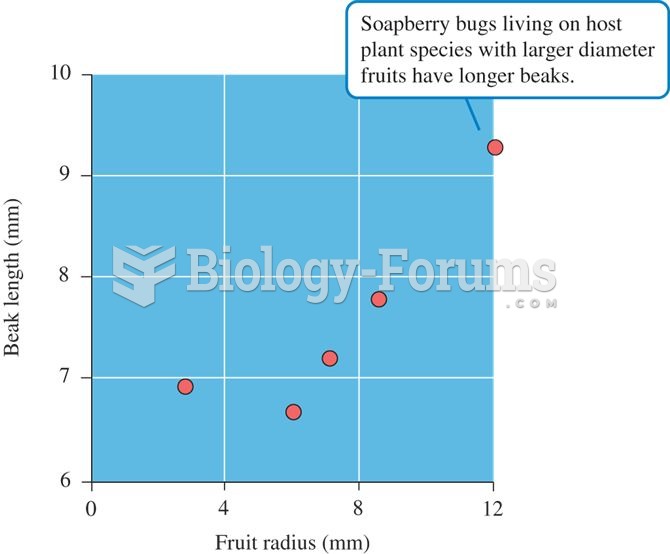 Relationship between fruit radius and beak length in populations of native and introduced species of
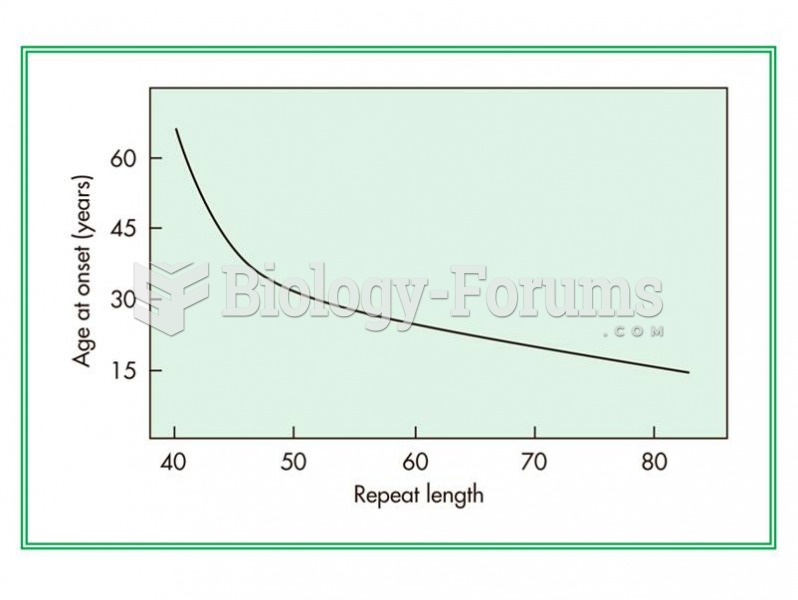 Relationship between the number of CAG repeats in a gene and the age of onset of Huntington disease.
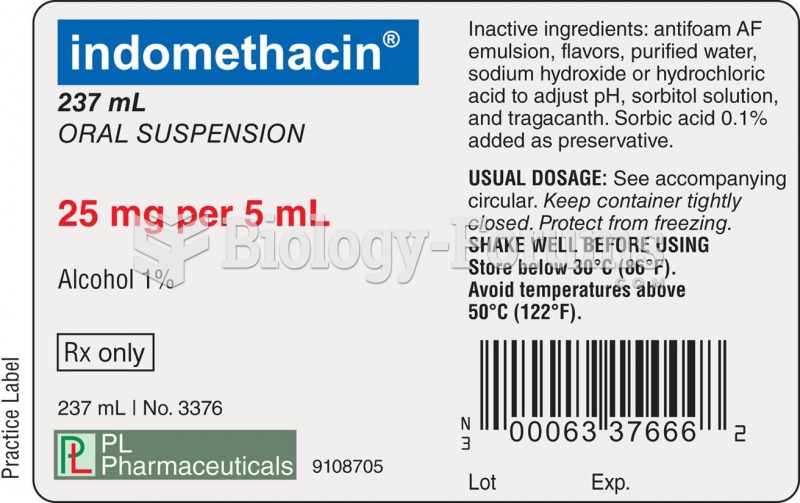 Some drug labels show the USP symbol; others do not.
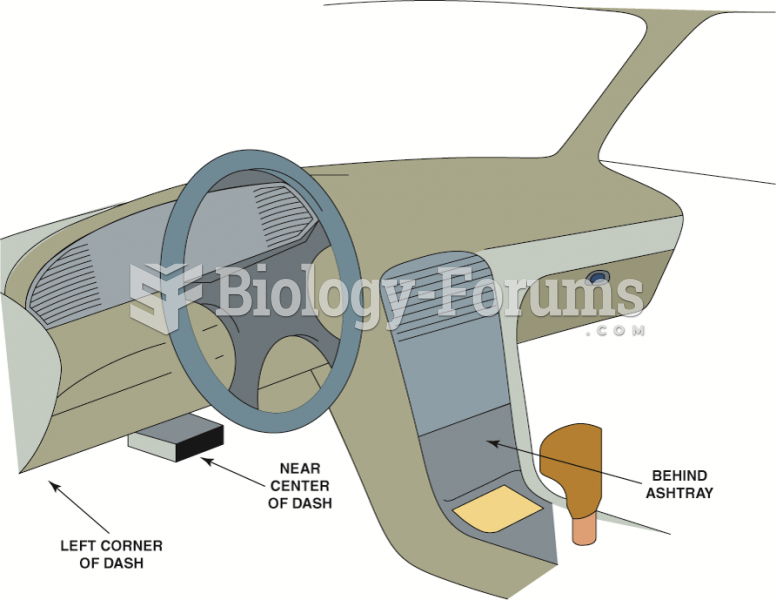 The data link connector (DLC) can be located in various locations.
 Acquiring Weather Data
 Testing motor function of cranial nerve VII - Show teeth