This topic contains a solution. Click here to go to the answer
|
|
|

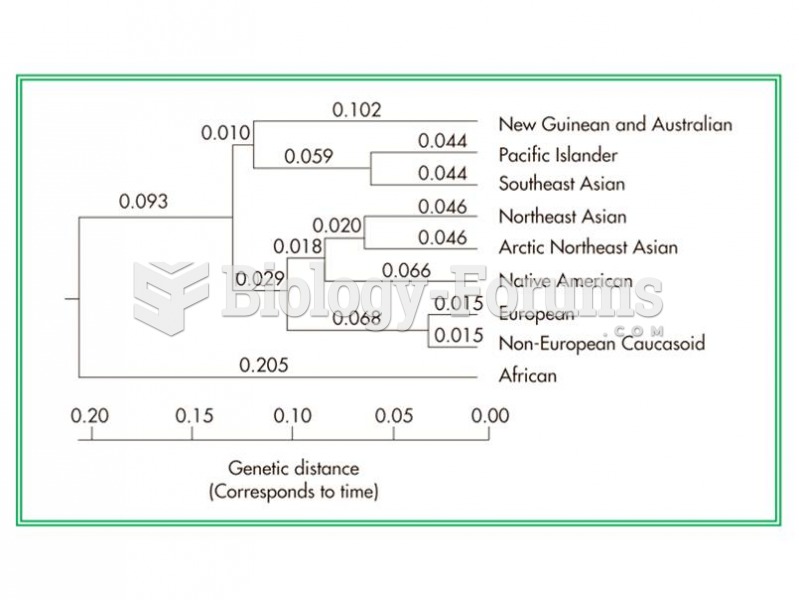 Phylogenetic tree based on the distribution of 120 alleles in 42 populations from around the world,
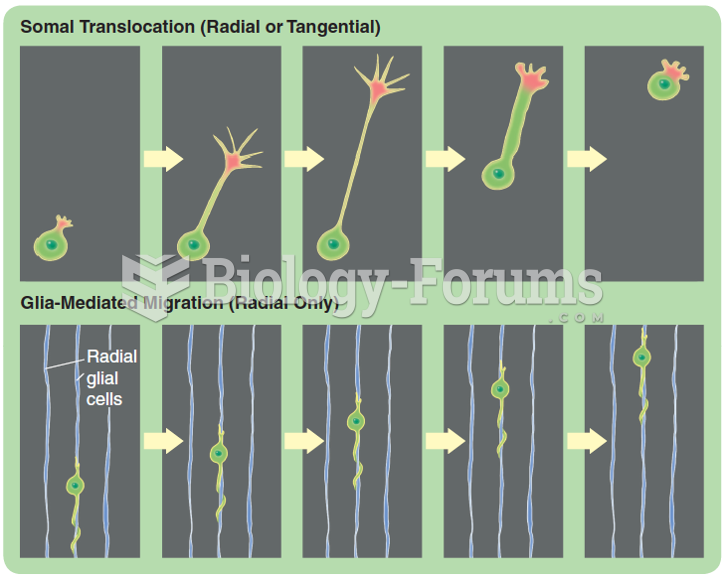 Two methods by which cells migrate in the developing neural tube: somal translocation and ...
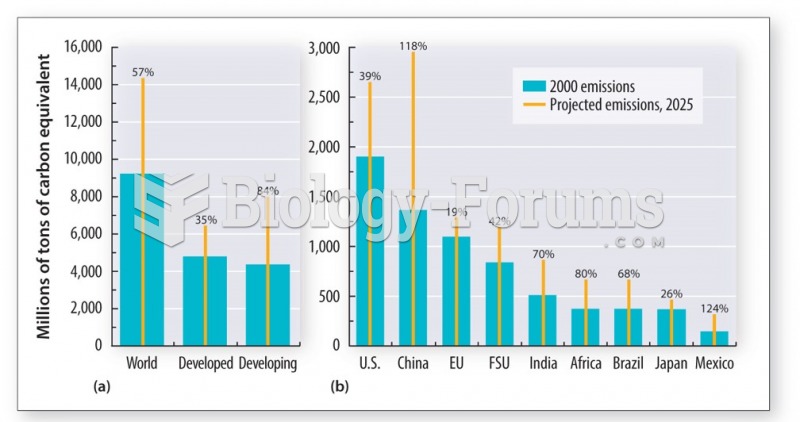 The developed countries must reduce the level of greenhouse gas emissions
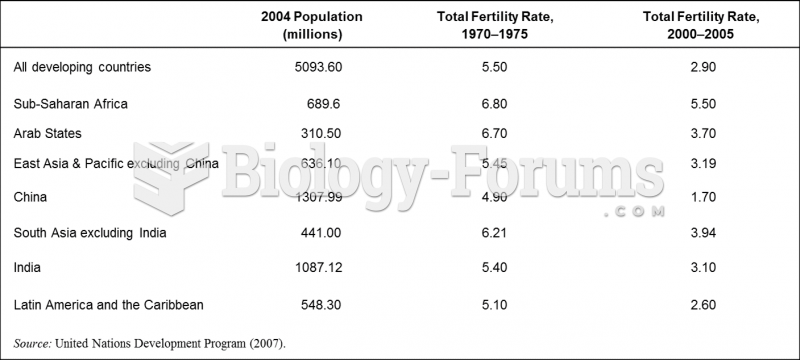 Fertility in the Developing World
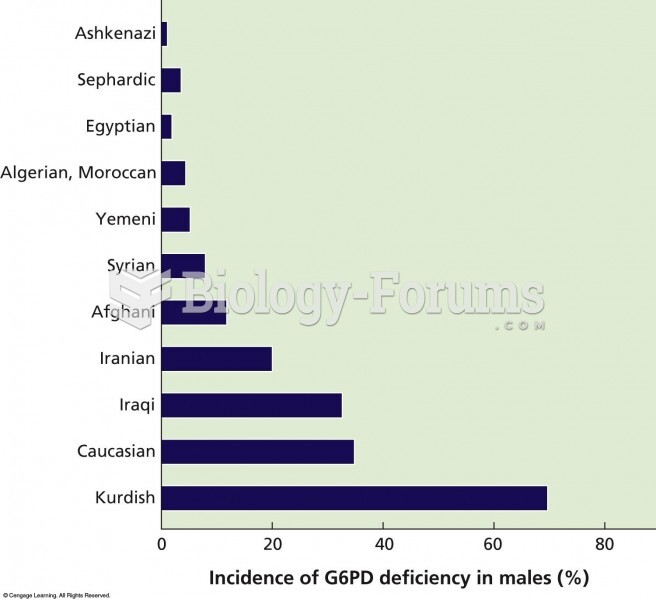 Distribution of glucose-6-phosphate dehydrogenase (G6PD) deficiency in various Jewish populations. B
 Genetic drift of an allele frequency