This topic contains a solution. Click here to go to the answer
|
|
|

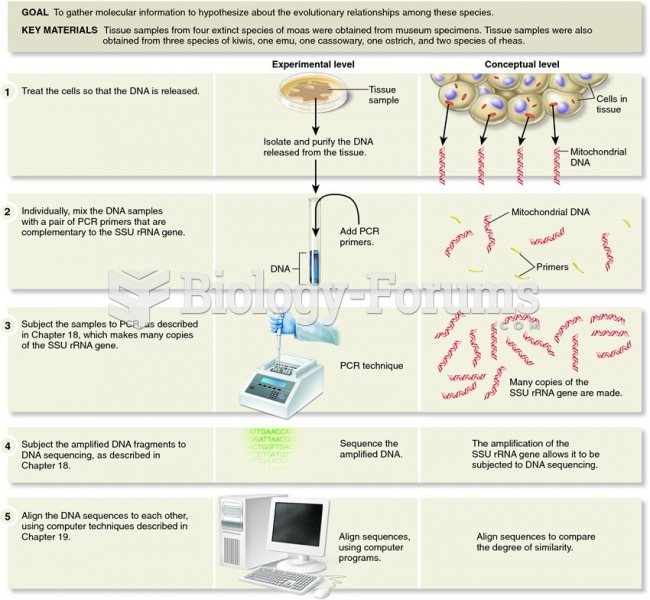 DNA analysis of phylogenetic relationships among modern and extinct flightless birds by Cooper and c
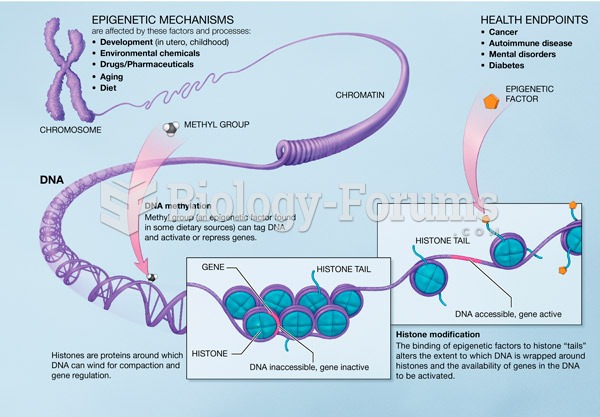 Genetic Information
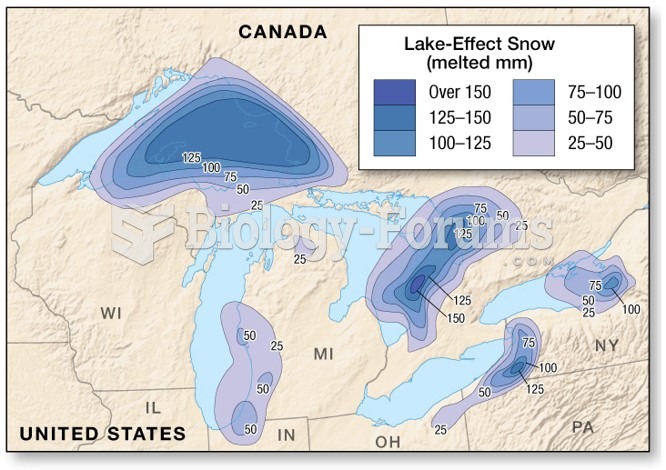 Distribution and Forms of Precipitation: Snow
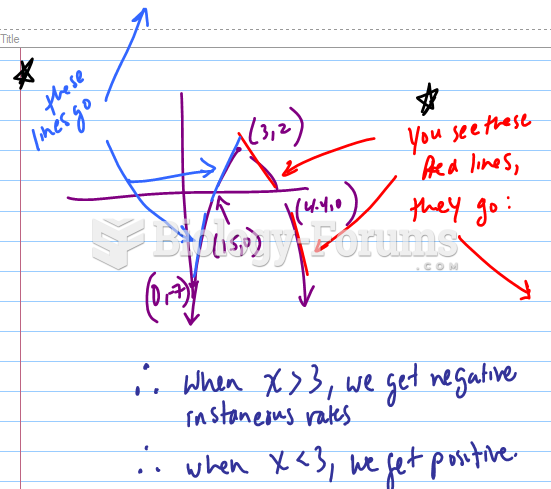 If a graph has the following x-intercepts, which value of x is the instantaneous rate of change ...
 Data management short answer q