This topic contains a solution. Click here to go to the answer
|
|
|

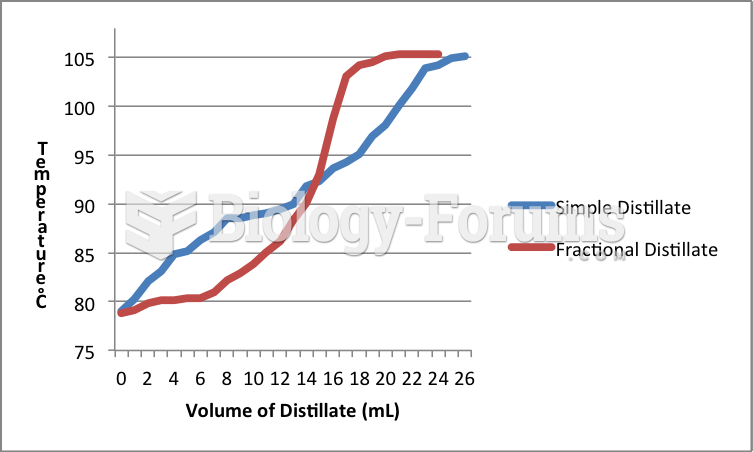 Distillation Graph Comparision
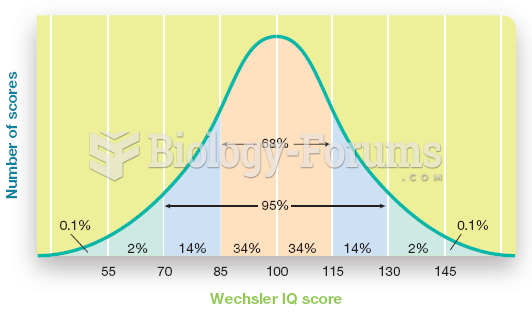 The Normal Distribution of Scores for a Standardized Intelligence Test
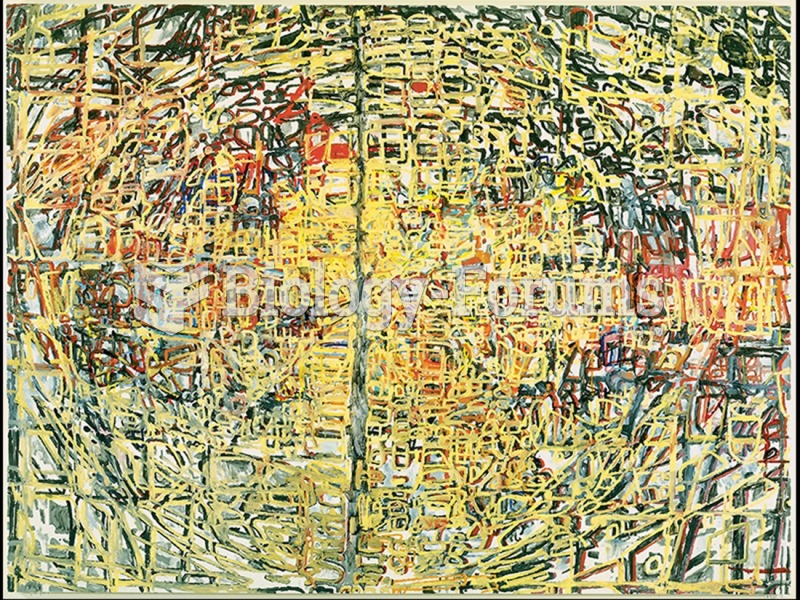 Terry Winters, Color and Information.
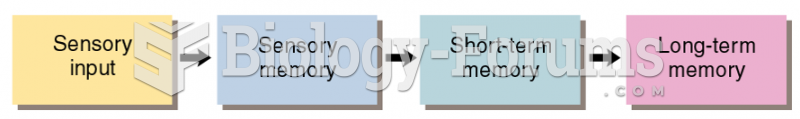 A Simplified Model of Information Flow in Human Memory
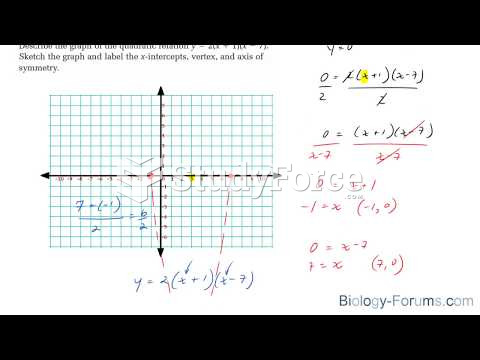 How to graph quadratic equations that are in factored form y=a(x−r)(x−s)
 Relative changes in distribution of sleep stages over the lifespan