This topic contains a solution. Click here to go to the answer
|
|
|

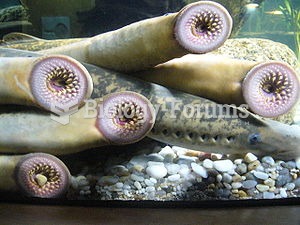 Lampreys (sometimes also called lamprey eels) are a family of jawless fish
 The Median Age of the U.S. Population
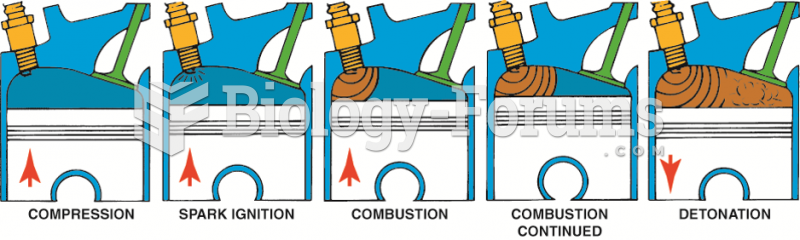 Detonation is a secondary ignition of the air–fuel mixture. It is also called spark knock or ...
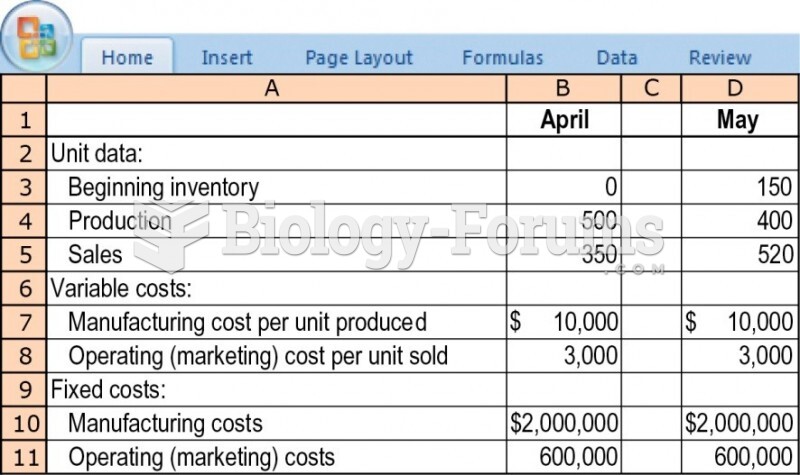 Variable and absorption costing, explaining operating-income differences.
 A Gaucher cell showing accumulated fat stored in structures called lysosomes
 Summary of Single Variable Discrete Models