This topic contains a solution. Click here to go to the answer
|
|
|

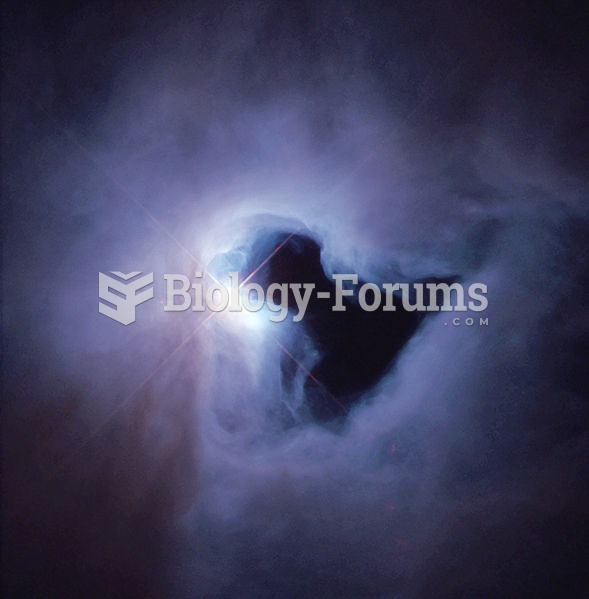 The reflection nebula NGC 1999 is brilliantly illuminated by V380 Orionis (center), a variable star
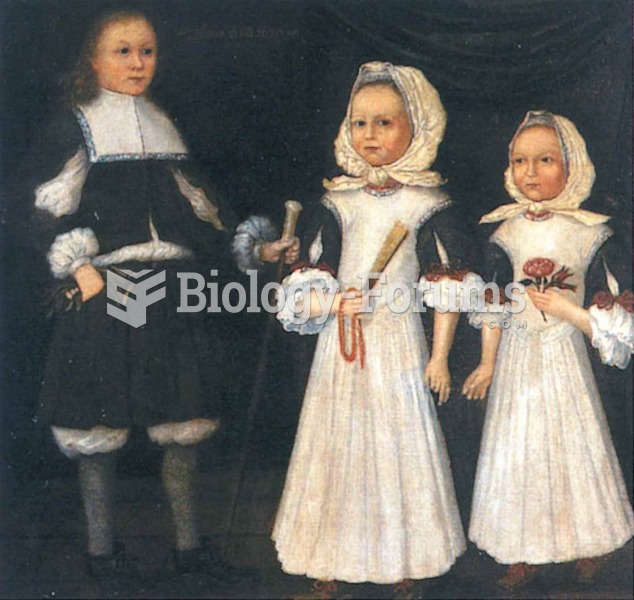 New England children like David, Joanna, and Abigail Mason (painted by an unknown artist around 1670
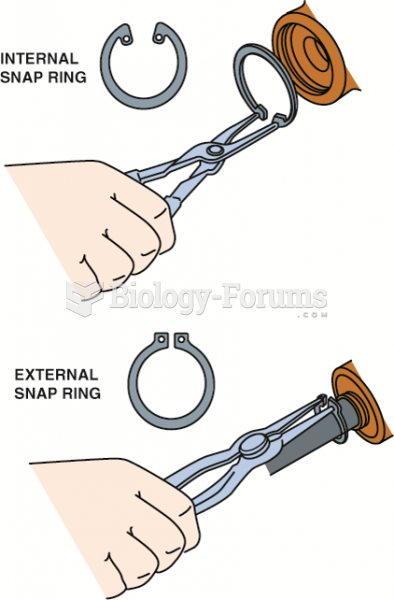 Snap-ring pliers are also called lock-ring pliers, and they are designed to remove internal and ...
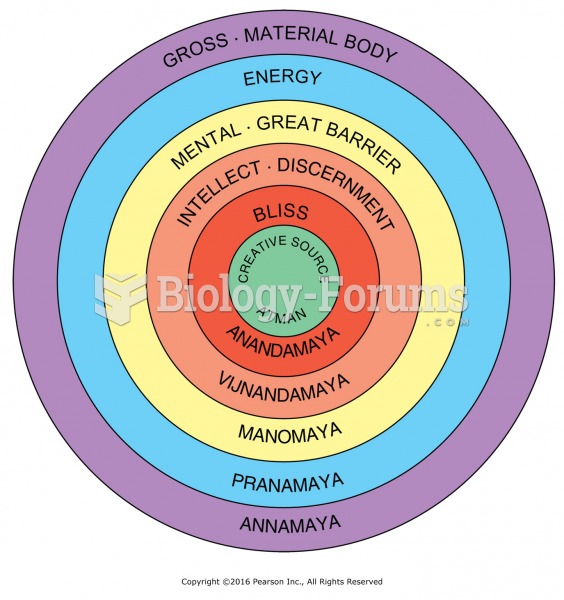 Five layers or sheaths called koshas in Ayurvedic philosophy.
 How to rearrange formulas to isolate for a variable (Part 2)
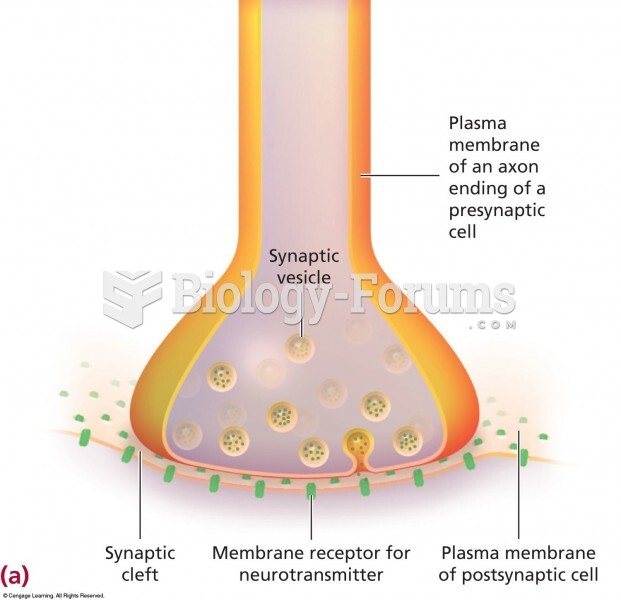 A thin cleft, called the synapse, separates one cell from another.