This topic contains a solution. Click here to go to the answer
|
|
|

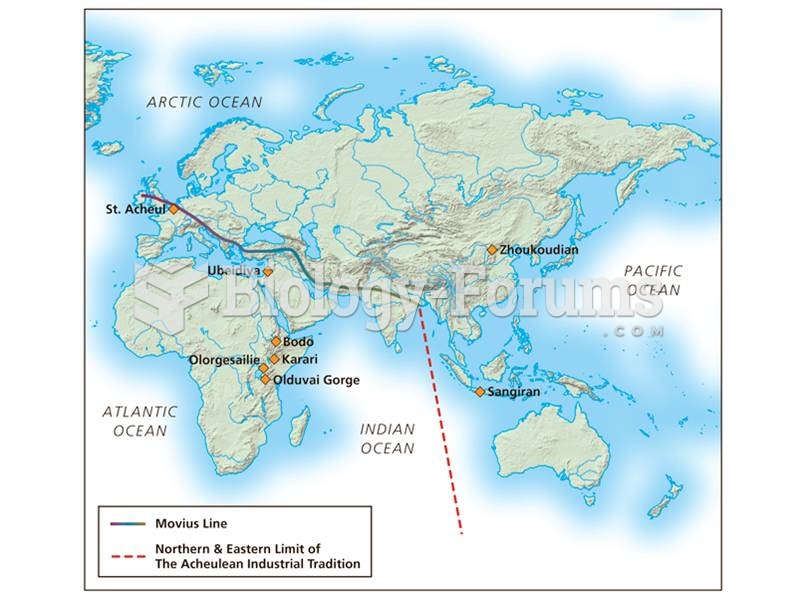 The Movius line separates regions of the world where Acheulean hand axes were made from regions wher
 Testing Distance Visual Acuity Using a Snellen Eye Chart
 An ECT sensor being tested using a digital meter set to DC volts. A chart showing the voltage ...
 Student Raises Hand in Class
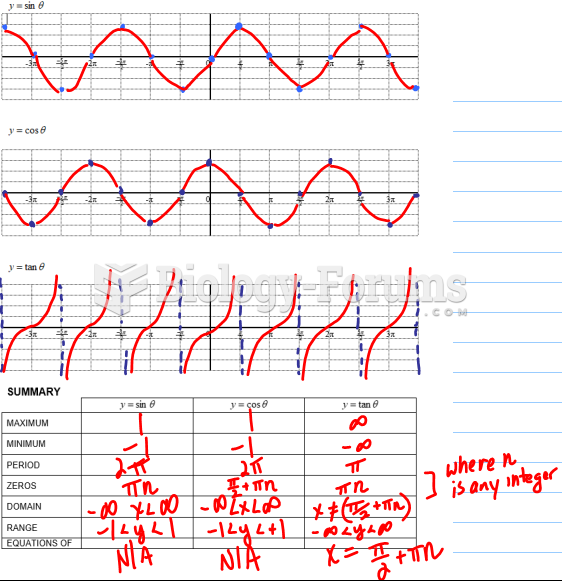 Graphs of Primary Trigonometric Ratios
 Find the equation of the normal line to f(x)=sinx+cosx at x = π.