This topic contains a solution. Click here to go to the answer
|
|
|

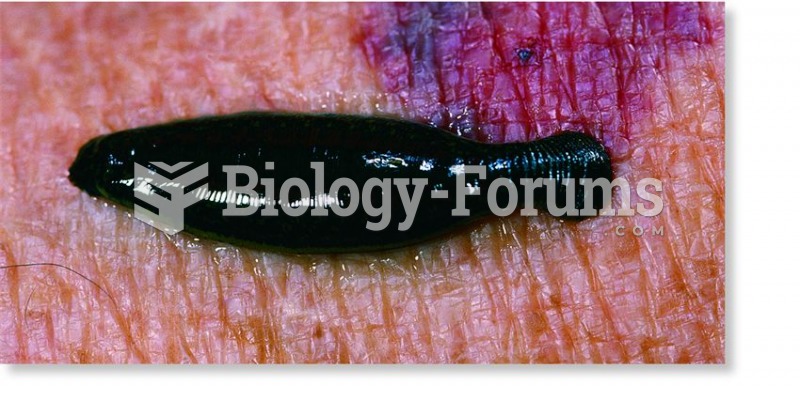 A leech, a member of the class Hirudinea.
 Goblet cells that line the intestine
 first day of my chemistry class.. this is what the teacher had to say
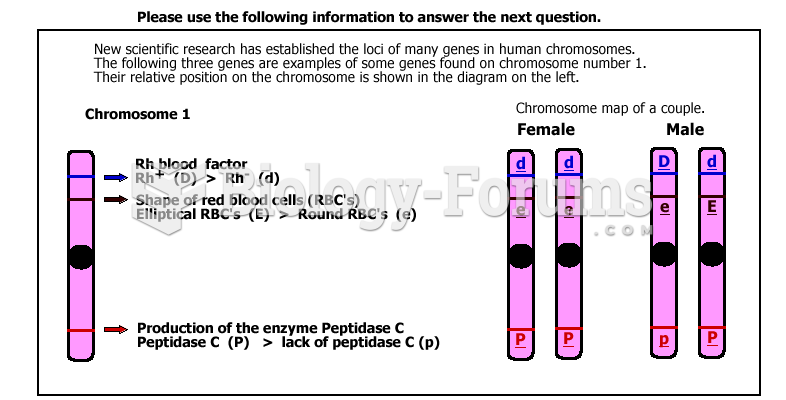 Chart to answer QN
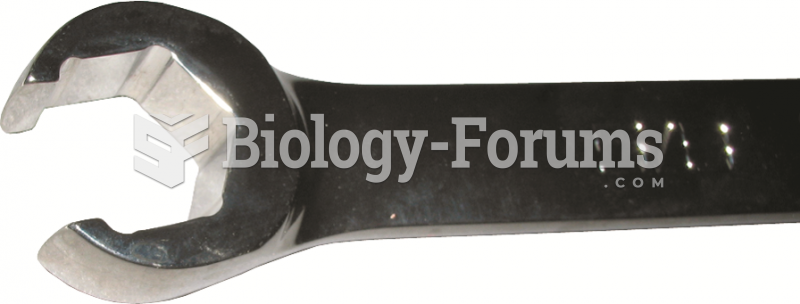 The end of a typical line wrench, which shows that it is capable of grasping most of the head of ...
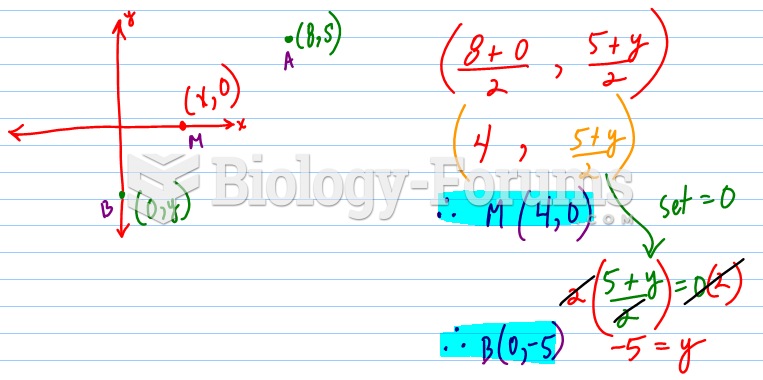 M is the midpoint of a line segment with endpoints A & B. If B is locates on the y-axis, and M ...