This topic contains a solution. Click here to go to the answer
|
|
|

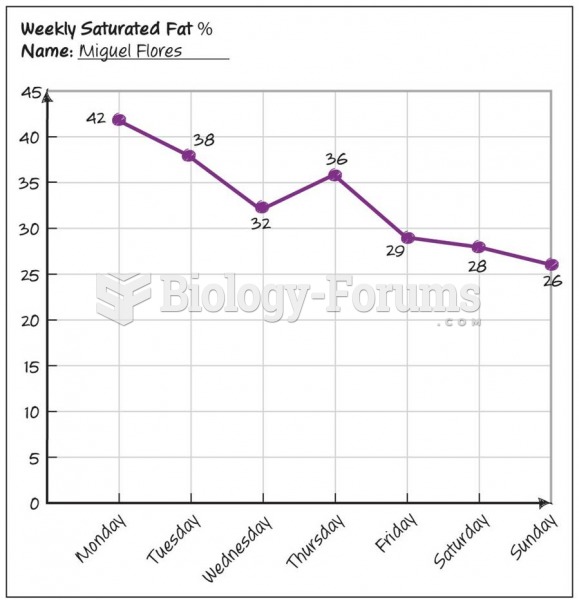 Progression Graph
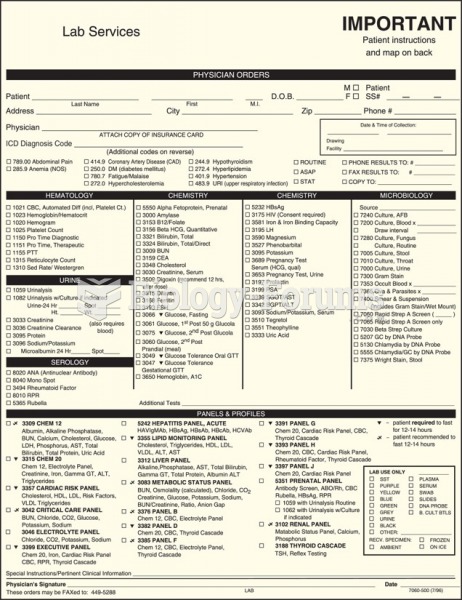 Laboratory requisition slip.
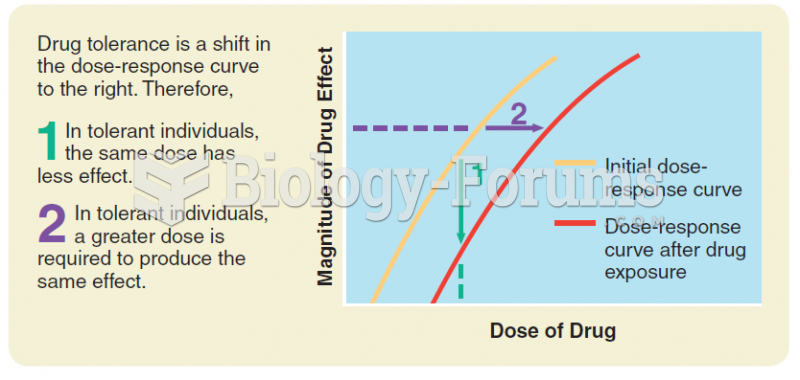 Drug tolerance: A shift in the dose-response curve to the right as a result of exposure to the drug.
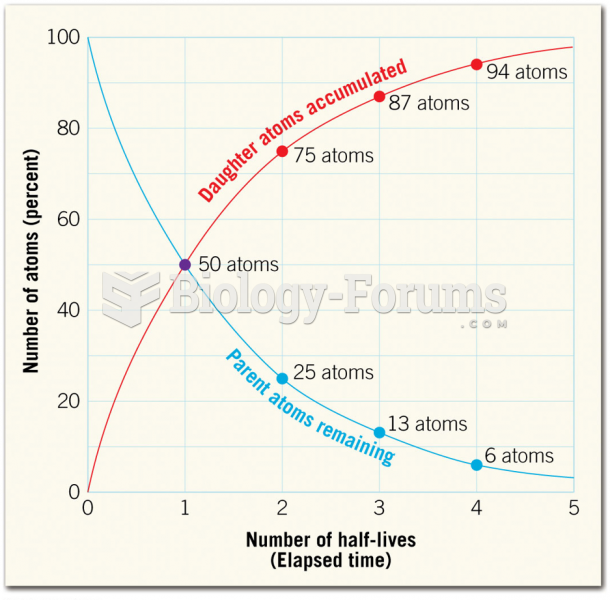 The Radioactive Decay Curve
 How to find the possible equations of a graph?
 Picture graph