This topic contains a solution. Click here to go to the answer
|
|
|

 Laboratory log
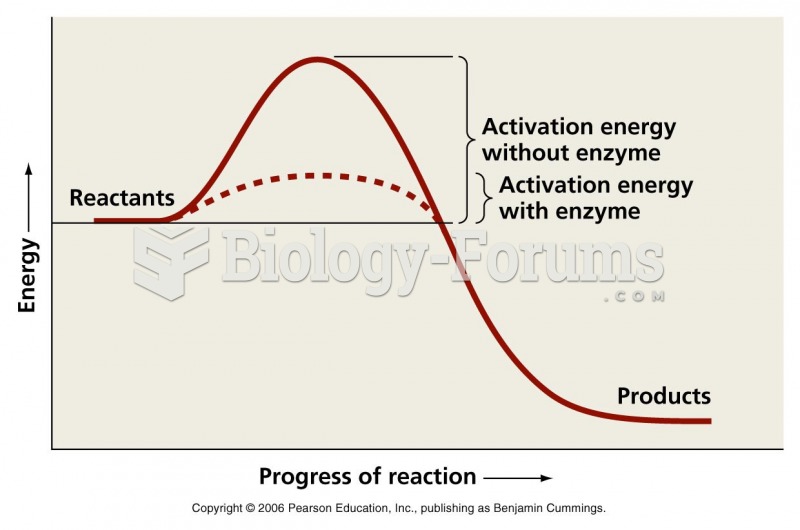 Activation energy graph
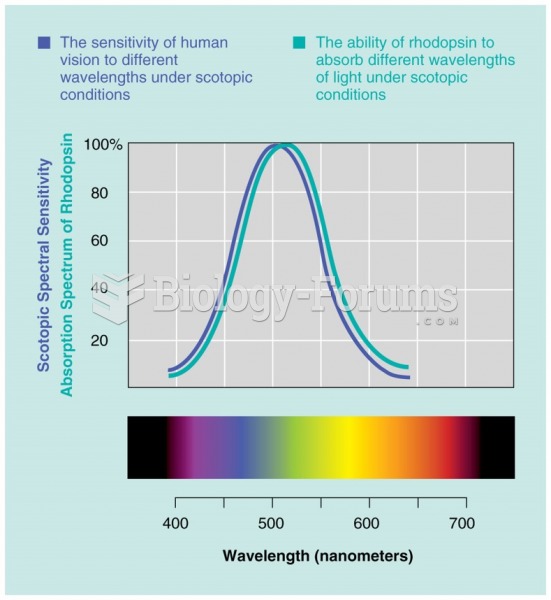 The adsorption spectrum of rhodopsin compared with the human scotopic spectral sensitivity curve.
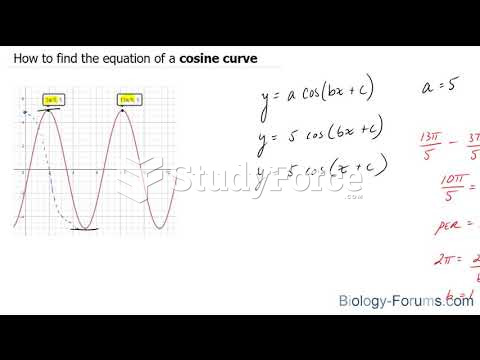 How to find the equation of a cosine curve
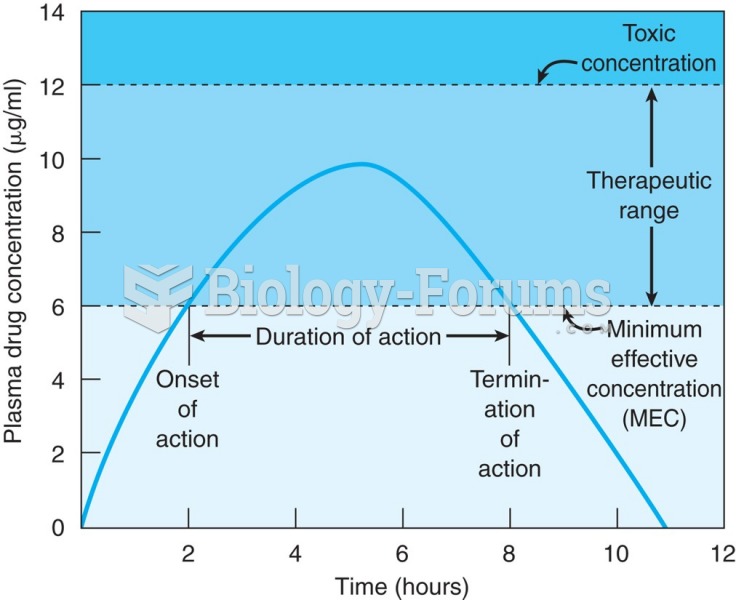 Graph showing oral administration of a single-dose drug. The time of onset is 2 hours and the end of ...
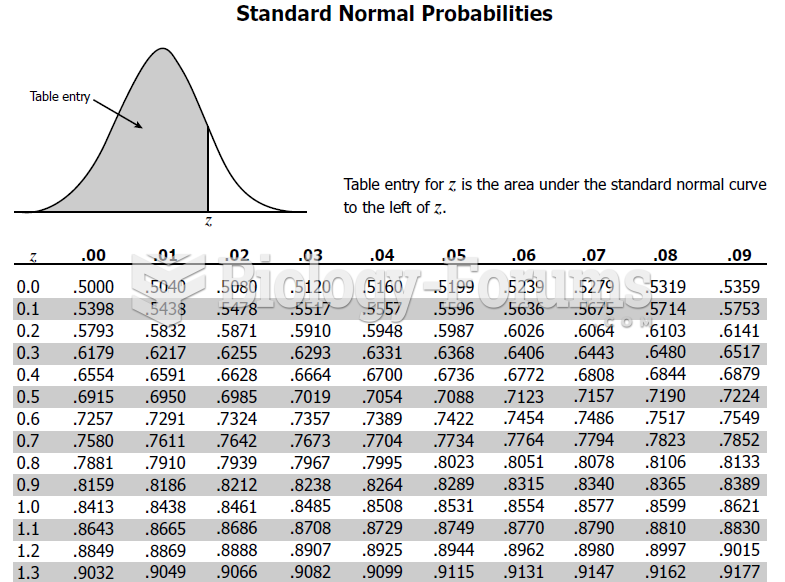 Assume z is a standard normal random variable. What is the value of z if the area to the right ...