Which of the following statements is FALSE about the use of charts in a research presentation?
a. Bar charts can only be single scale charts.
b. Pie charts and one-scale bar charts are used for similar purposes.
c. When the relationship being captured is the change in a variable through time, the vertical form of the bar chart is preferred with the x-axis as the time axis.
d. A pictogram is essentially a bar chart.
e. A stratum chart is equivalent to a divided bar chart.
Question 2
Most customers prefer impersonal, self-service customer service channels.
a. True
b. False
Indicate whether the statement is true or false

 False killer whales
 False Solomons Seal
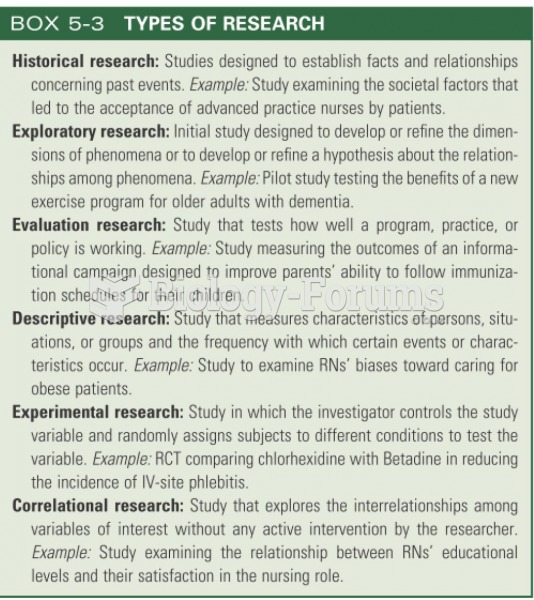 TYPES OF RESEARCH
 Object and Word Recognition After Vertices Have Been Eliminated (Adapted from Szwed, M., Cohen, L, Q
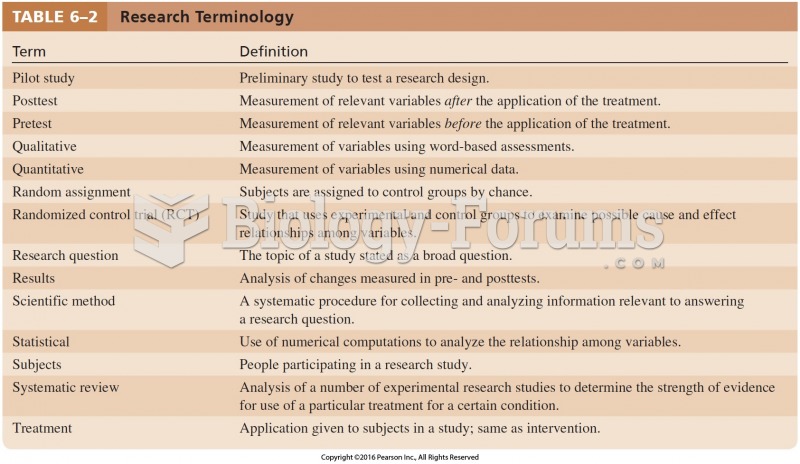 Research Terminology Cont.
 A Scalp/Head Injury Presentation