Which of the following statements about pie charts is false?
a. A pie chart is a graphical representation of a relative frequency distribution.
b. You can always determine frequencies for each category by looking at a pie chart.
c. The total percentage of all the slices of a pie chart is 100.
d. The area of a slice of a pie chart is the proportion of all the individuals that fall into that particular category.
Question 2
When dealing with the problem of non-constant variance, the reciprocal transformation means using _____.
a. 1/x as the independent variable instead of x
b. x2 as the independent variable instead of x
c. y2 as the dependent variable instead of y
d. 1/y as the dependent variable instead of y

 Organic Synthesis Flow Chart
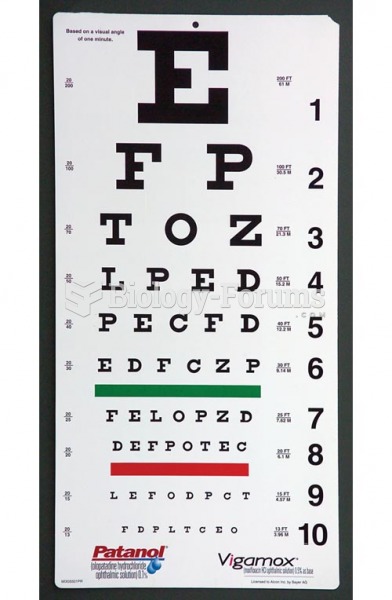 Visual Acuity Testing, Snellen Vision Chart
 A 1998 false-colour near-infrared image of Uranus showing cloud bands, rings, and moons obtained by
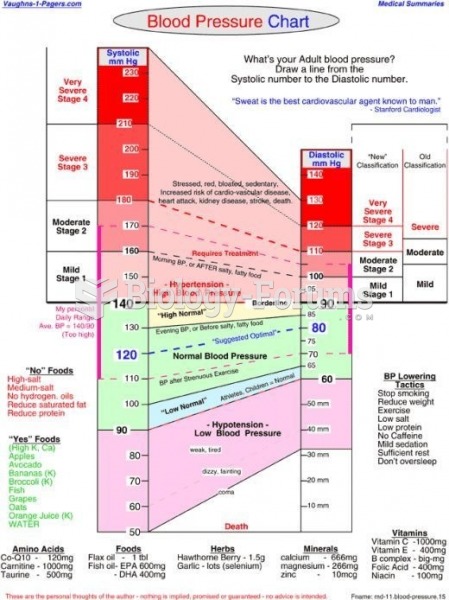 Blood Pressure Chart
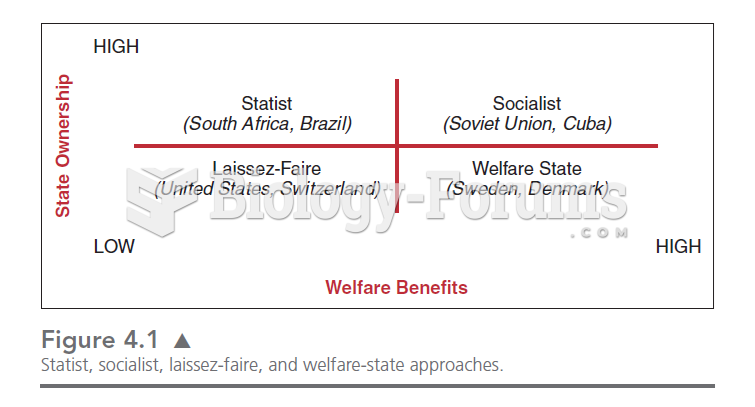 This chart illustrates the four quadrants in which we can place the relationships between the state
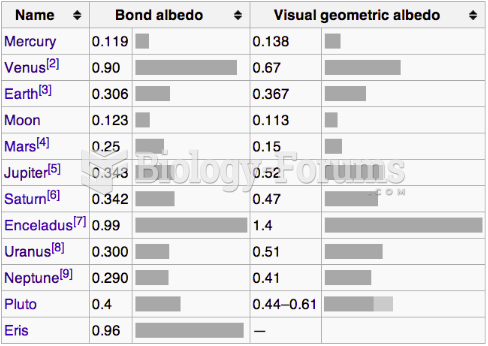 Albedo Chart