This topic contains a solution. Click here to go to the answer
|
|
|

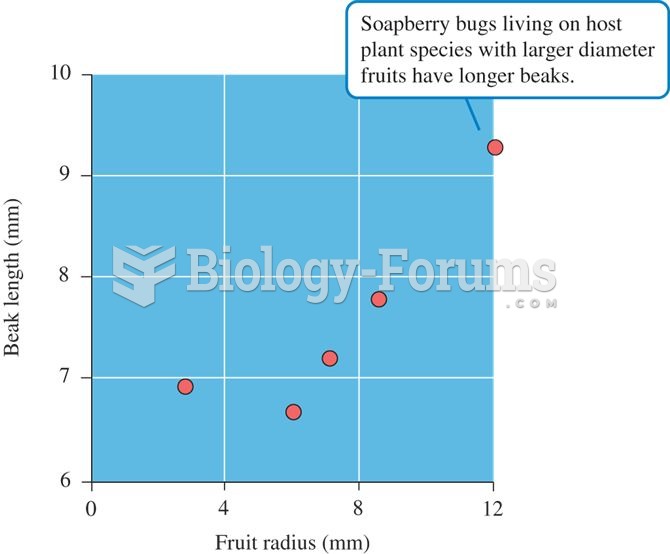 Relationship between fruit radius and beak length in populations of native and introduced species of
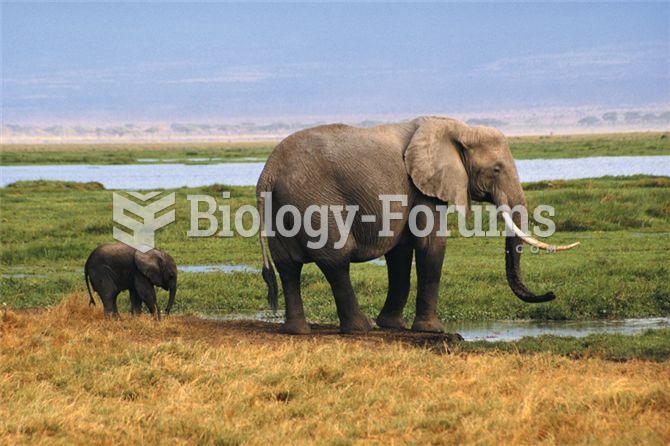 The deer mouse and the African elephant represent extremes among mammals of r versus K selection.
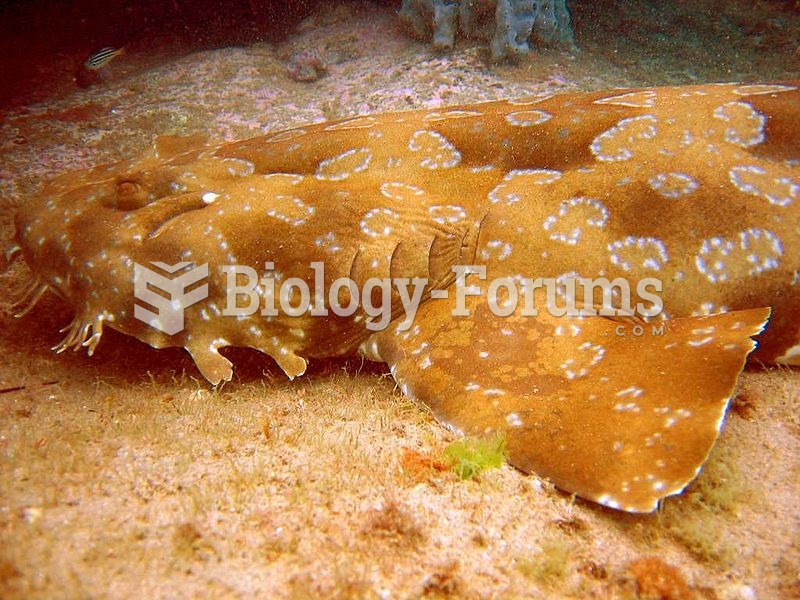 The spotted wobbegong is the largest wobbegong shark, reaching a length of around 3 m
 The ability to roll the tongue is one of several traits that represent the dominant allele.
 Ginkgo Biloba label. The label indicates the product is standardized to percentages of the two ...
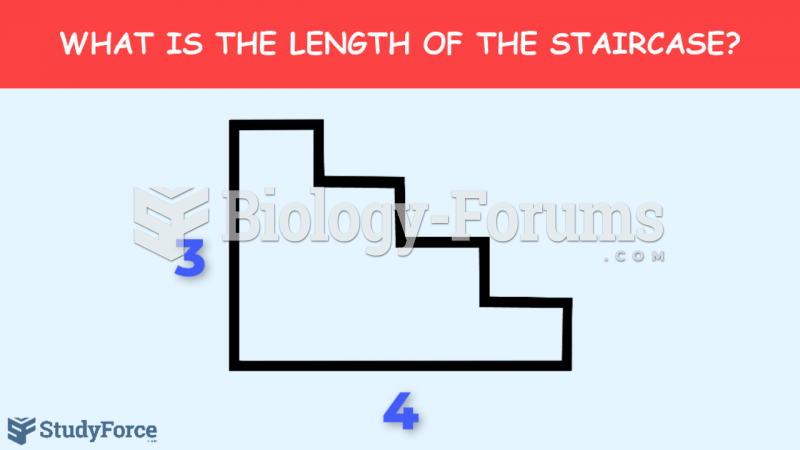 What is the length of the staircase?