|
|
|

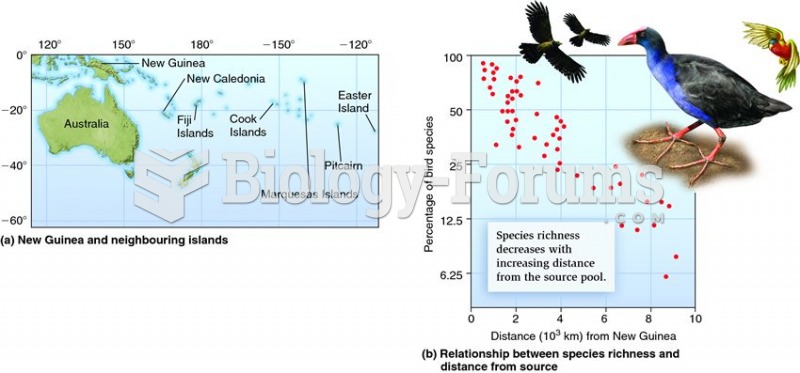 Species richness decreases with distance from the source pool.
 Distance from Earth to Sun schematic
 Ginkgo Biloba label. The label indicates the product is standardized to percentages of the two ...
 Fuel should be heard returning to the fuel tank at the fuel return line if the fuel pump and ...
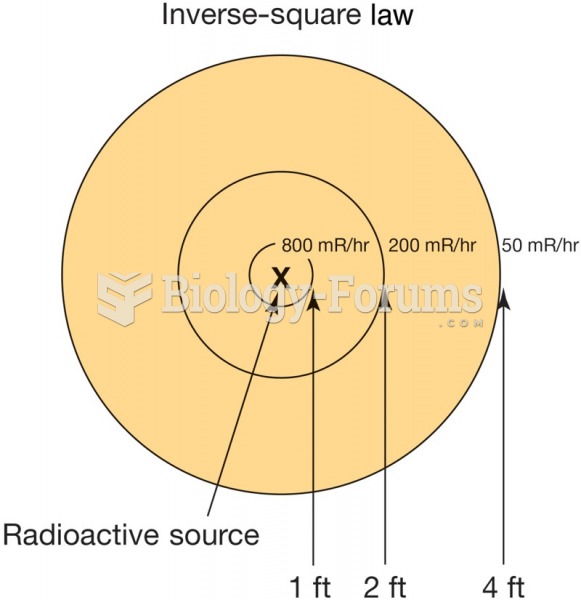 The inverse-square law and its effects. Doubling your distance away from a radioactive material ...
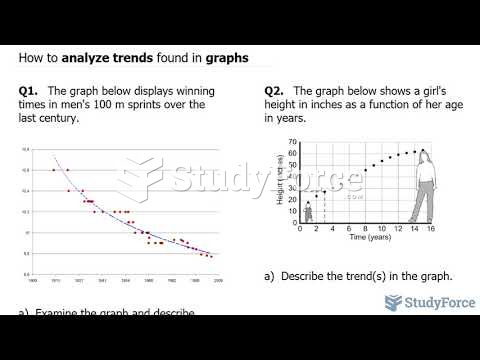 How to analyze trends found in graphs