|
|
|

 A downward-sloping spark line usually indicates high secondary ignition system resistance or an ...
 How to graph line equations without a table of values
 Tai chi walk along straight line. From tai chi stance, shift weight to the back leg and turn the ...
 Excel hardware is introducing a new product on a new product line of capacity 800 units per ...
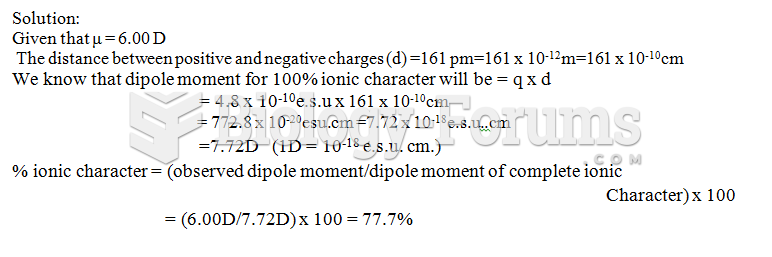 LiH has an experimental dipole moment, μ = 6.00 D. If LiH were 100% ionic, the distance ...
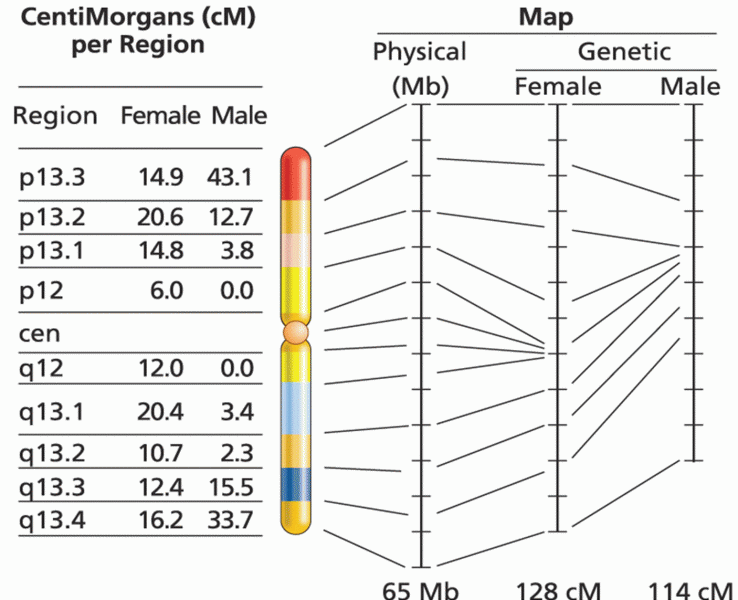 Physical distance versus recombination distance on human male and female chromosome 19